Download
1 / 18
180 likes | 184 Views
This paper discusses the need for proper statistical tests to determine significant differences in forest inventory data, especially when using tools like FIA EVALIDator. It explores the impact of covariance and the importance of understanding sampling design and estimation procedures.

E N D
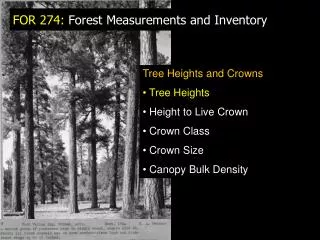
U.S. Forest Service Forest Inventory and Analysis James A. Westfall Scott A. Pugh John W. Coulston Conducting tests for statistically-significant differences using forest inventory data
A key output of nearly all NFI efforts is sample-based estimates for attributes of interest (e.g., forestland area or net cubic volume). Often, the statistical estimators are documented and known such that estimates and standard errors are easily computed. • It is also desirable to make comparisons and determine statistically significant differences. • Between estimates for current values • Change over time in specific attributes CONTEXT
However, many users of inventory data rely on tools that allow estimates to be easily generated, e.g., FIA EVALIDator. • Such tools provide statistically valid estimates (along with sampling errors) that can be used for wide range of purposes. However, these tools usually do not provide the information needed to properly conduct statistical tests for differences between current values or for trends (exc. GRM). CONTEXT
Key Point #1: EVALIDator output does provide the necessary information to test for differences when the estimates arise from independent samples, i.e., no covariance is needed to compute the standard error. • Key Point #2: Under FIA estimation procedures, comparisons are rarely based on independent samples, i.e., the comparisons are made within the same population such as a state, county, etc. Why? Domain-based estimation is used. CONTEXT
5 Panel Design CONTEXT
Remember this: Within a population, all plots are used for every estimate! • Example: The population has 100 sample plots of which 20 are softwood forest type; 30 are hardwood forest type; 50 nonforest. • Q1: How many plots are used to estimate cubic volume on forestland? A: 100 • Q2: How many plots are used to estimate area of softwood forest type? A: 100 • Q3: How many plots are used to estimate the area of hardwood forest type? A: 100 CONTEXT
Therefore: The samples upon which two current estimates are based are usually not independent. • Similarly, trend estimates are derived from remeasurement of permanent plots, so comparisons of estimates at two points in time are also not independent. • Aside, valid trend estimates and sampling errors can be obtained by calculating the difference at the plot level and computing the stats based on these values. CONTEXT
Armed with only estimates and sampling errors from tools like EVALIDator, many analysts are tempted to create a confidence interval for each estimate and determine statistical significance is attained if there is no overlap. • This method assumes 1) independent samples, and 2) additivity of standard errors. • When samples are not independent, this method is incorrect. • Even when there are independent samples, it is variances not standard errors that are additive, so the test result is not always correct. ISSUE
V(y-x) = V(y)+V(x)-2Cov(y,x) -> Sign of covariance indicates whether std error will get smaller or larger in comparison to assuming independent samples. • For comparisons of current estimates, covariance is usually negative. • For comparisons of differences over time, covariance is usually positive. ISSUE
Data example for comparison of current basal area per acre on hardwood and softwood forest types ISSUE
Compare differences in area proportions for hardwood and softwood forest types in 13 NE states. Comparisons
Compare differences in area proportions for maple/ beech/birch and softwood forest types in 13 NE states. Comparisons
Compare differences in basal area per acre for hardwood and softwood forest types in 13 NE states. Comparisons
Compare differences in forestland area proportion at Time 1 and Time 2 in 13 NE states. Comparisons
Understanding of sampling design and estimation procedures is needed to ascertain whether samples are independent, especially when using existing analytical tools such as EVALIDator and doing ad hoc statistical tests. The use of the overlapping CI method is not appropriate as a substitute for proper computation of std errors. Conclusions
The impact of covariance depends on the structure of the population and the attributes being compared. Can’t make general statements regarding magnitude. Further work on analytical tools such as EVALIDator is needed to extend capabilities; however wide range of possible comparisons makes implementation difficult. Conclusions
To maintain credibility and help ensure decisions regarding forest resourcesare scientifically-based, it is imperative that tests for differences are conducted properly. More detailed explanations (panel design, stratification for variance reduction, etc.) in upcoming NRS Res. Paper. PDF should be available very soon. Conclusions