Download
1 / 33
350 likes | 624 Views
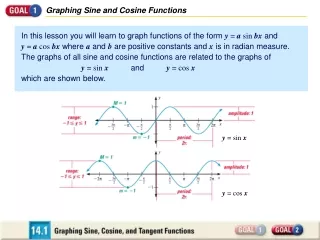
10.1 Graph Sine, Cosine, and Tangent Functions. What graphs are periodic? What graphs have maximum and minimum values? What values do you need to graph the or the ?. Vocabulary.

E N D
10.1 Graph Sine, Cosine, and Tangent Functions What graphs are periodic? What graphs have maximum and minimum values? What values do you need to graph the or the ?
Vocabulary • Amplitude of each functions graph: half the difference of the maximum and the minimum , or ½ () = ½[1−(−1)] = 1. • Periodic: the graph has a repeating pattern. • Cycle: the shortest repeating portion of the graph. • Period: the horizontal length of each cycle.
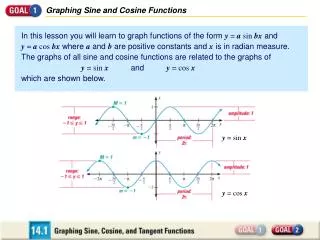
Parent Graph of D: all real numbers R: This graph has a horizontal length and a period of 2. The x-intercepts for occur when
Parent Graph of D: all real numbers R: This graph has a horizontal length and a period of 2. The x-intercepts for occur when
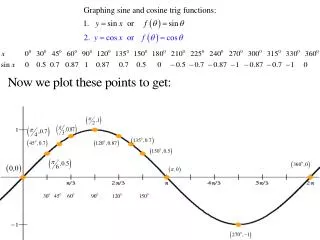
Each graph shows five key x-values on the interval when . Maximum x values occur at the blue points. Minimum x values occur at the green points. X-intercepts occur at the red points.
π π 2 2 = = b 1 1 3 1 π 2 4 4 ( , 4) a. The amplitude is a = 4 and the period is 2π. 2 3π ( 2π, 0) Intercepts: (0, 0); (π,0); (2π,0) = ( , – 4) 2 ( 2π, 4) Maximum: = Minimum: ( 2π, – 4) = Graph (a)y = 4 sin x SOLUTION
π π 2 2 = = . b 4 1 1 3 π π π π 4 4 2 ( , –1) b. The amplitude is a = 1 and the period is 2 2 2 2 π 3π Intercepts: ( , 0) ( , 0) = ( , 0); = ( , 0) 8 8 π (0, 1); Maximums: ( , 1) 2 π Minimum: = ( , –1) 4 Graph (b)y = cos 4x. SOLUTION
π π 2 2 = = 2π b 1 The amplitude is a = 2 and the period is 1 π 3π 1 3 2 Intercepts: ( 2π, –2) ( 2π, 0) ( 2π, 0) = ( , 0); = ( , 0) 4 4 2 2 (0, 2); Maximums: ( , 2) 2π π Minimum: = ( , –2) 4 Graph the function. 1. y = 2 cosx SOLUTION
Graph the function. 2. y = 5 sinx π π 2 2 = = 2π 1 b The amplitude is a = 5 and the period is 1 1 π 4 Intercepts: (0, 0) (π, 0) = ( 2π, 0) = = ( , 0) 2π 2 2 ( 2π, 5) = Maximums: ( , 5) SOLUTION
Changes in a and b Notice how changes in a and b affect the graphs of and . • When the value of a increases, the amplitude increases. • When the value of b increases, the period decreases.
Graph the function. 3. f (x) = sinπx π π 2 2 = = 2 b π The amplitude is a = 1 and the period is 1 3 1 1 4 4 Intercepts: (0, 0) (1, 0); (2, 0) = ( 2, 0) = 2 2 ( 2, 1 = Maximums: ( , 1) 3 Minimum: ( 2, –1) = ( , –1) 2 SOLUTION
Graph the function. 4. g(x) = cos 4πx π π 2 2 = = b 4π The amplitude is a = 1 and the period is 1 1 1 1 3 1 1 1 1 1 2 Intercepts: ( ,0) = ( , 0); ( , 0) = ( , 0) 4 8 2 2 2 2 8 2 4 Maximums: ( , 1) ( 0, 1); 1 Minimum: ( ,–1) = ( , –1) 4 SOLUTION
What graphs are periodic? The graphs of and are periodic. • What graphs have maximum and minimum values? The graphs of and have maximum and minimum values. • What values do you need to graph the or the ? You can use the maximum and minimum values and the x-intercepts to graph and .
10.1 Assignment, day 1 Page 617, 3 – 15 No graphing calculators are to used for this assignment. Graphing solutions need to include: • intercepts information • maximum information • minimum information • graphs Learn where this information comes from!
10.1 Graph Sine, Cosine, and Tangent Functions, day 2 What graphs have asymptotes? What is frequency? What values do you need to graph tangents?
π x. Graphy = cos 2 π 2 π 2 = = b 2π 1 1 1 1 1 3 1 ( 1, 0) = ( , 0); 4 The amplitude is a = 1. and the period is 4 2 2 2 4 2 ( 1 , 0) ( 1, – ) 3 Intercepts: = ( , 0) 4 1 1 2 (0, ) ; Maximums: (1, ) 2 1 1 Minimum: = ( , – ) 2 2 SOLUTION
Frequency • Frequency: the reciprocal of the period which gives the number of cycles per unit of time. The periodic nature of trig functions is useful to model oscillating motions or repeating patterns (sound waves, motion of a pendulum,…) http://boingboing.net/2013/03/12/video-water-appears-frozen-in.html
Audio Test A sound consisting of a single frequency is called a pure tone. An audiometer produces pure tones to test a person’s auditory functions. Suppose an audiometer produces a pure tone with a frequency fof 2000 hertz (cycles per second). The maximum pressure Pproduced from the pure tone is 2millipascals. Write and graph a sine model that gives the pressure Pas a function of the time t(in seconds).
Graph the model. The amplitude is a = 2 and the period is = 1 b π 4000 = b 2000 = π 2 frequency = period 1 1 1 3 2 4 4 f ( , 0) ( , 2) ( , –2) (0 , 0); Intercepts: 1 1 1 1 2000 2000 2000 = ( , 0) ; 4000 1 1 ( , 0) Maximum: = ( , 2) 1 2000 8000 2000 Minimum: 3 = ( , –2) 8000 SOLUTION Find the values of aand bin the model P = asinbt. The maximum pressure is 2, so a = 2. You can use the frequency fto find b. STEP 1 The pressure Pas a function of time tis given by P = 2sin4000πt. STEP 2
5. y = sinπx π 2 π 2 = = b π The amplitude is a = 2. and the period is 1 1 , 1 1 1 1 1 3 1 1 3 , 2 4 4 4 4 2 4 4 4 2 4 Intercepts: ( (0 , 0); ) 2, 0 = (1, 0) ; (2, 0) Maximums: ( 2, ) ( ) = – – ( 2, ) ( ) Minimum: = Graph the function. SOLUTION
Graph the function. 6. y = cosπx π 2 π 2 = = b π The amplitude is a = 2. and the period is 1 1 1 1 1 1 1 1 1 3 1 2 3 3 3 4 3 2 4 3 3 2 , , ( ) ( Intercepts: ( ( ); ) 2, 0 ) 0 2, 0 0 = = ( 0, ); ( 2, ) Maximums: – – ( 2, ) ( ) Minimum: = 1, SOLUTION
π 2 π 2 = b 3 The amplitude is a = 2 and the period is 3 π 1 π 1 π 2π 2π 2π 2π 3 4 2 4 2 6 , , , , , ) ) ); ( (0 , 0); ( 2 2 0 0 0 ( Intercepts: = 3 3 3 3 ( ) ) Maximums: ( = – ) ( – ) ( Minimum: 2 2 = Graph the function. 7. f (x) = 2 sin 3x SOLUTION
Graph the function. 8. g(x) = 3 cos 4x π 2 π 2 = = b 4 The amplitude is a = 3 and the period is 1 3 1 π π π π π π π 3π 2 8 4 4 2 2 4 , , , , , ( ) ); ( ) ) 0 3 0 0 2 ( ( Intercepts: = = 2 2 2 0 ) Maximums: (0 , 3); ( – ) ( – ) ( Minimum: 3 2 = SOLUTION
Graph of • The domain is all real numbers except odd multiples of . At these x-values, the graph has vertical asymptotes. • The range is all real numbers. • The function does not have a maximum or minimum value. The graph of does not have an amplitude. • The graph has a period of . • The x intercepts of the graph occur when
Graphing Key Points • Graph the x-intercept • Graph the x-values where the asymptotes occur. • Graph the x-values half-way between the x-intercept and the asymptotes. • At each halfway point, the function’s value is either .
Halfway points: ( , 2) ( , 2); ( , a) Graph one period of the function y = 2 tan 3x. = = ( , – 2) ( , – 2) ( , – a) – – – = = π π π π The period is = . b 3 12 12 Intercepts: (0, 0) π π π π π π π π π , or x = ; x = Asymptotes: = 4b 2b 4b 2b 2 3 4 3 2 3 4 3 6 π – – – , or x = x = = 6 SOLUTION
Graph one period of the function. 12. f (x) = 2 tan 4x SOLUTION The period is Intercepts: Asymptotes: Halfway points:
Graph one period of the function. 13. g(x) = 5 tan πx SOLUTION The period is Intercepts: Asymptotes: Halfway points:
What graphs have asymptotes? • What is frequency? The reciprocal of the period which gives the number of cycles per unit of time. • What values do you need to graph tangents? You can use the asymptotes, the x-intercepts, and the x-values halfway between the x-intercepts and the asymptotes to graph
10.1 Assignment, day 2 Page 617, 16-24 all No graphing calculators are to used for this assignment. Graphing solutions need to include: • intercepts information • maximum information • minimum information • asymptotes • graphs Learn where this information comes from!