Download
1 / 13
140 likes | 325 Views
Geography 360 Principles of Cartography. May 19, 2006. Outlines: Digital Elevation Model. How is DEM different from map display? DEM is data structure, not map What is DEM? Digital representation of elevation Data structure for representation stored in the computer Three commonly used DEM

E N D
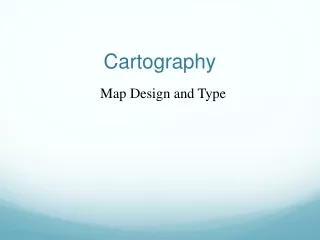
Geography 360Principles of Cartography May 19, 2006
Outlines: Digital Elevation Model • How is DEM different from map display? • DEM is data structure, not map • What is DEM? • Digital representation of elevation • Data structure for representation stored in the computer • Three commonly used DEM • Contour • TIN • Grid (most of time considered equivalent to DEM)
Phenomenon, data, map Refer back to SDTS spatial data concepts • Distinguish these
DEM • Data representation is different from map display • How is elevation (or the third dimension) represented in database? • DEM is a rubric term that refers to data structure used to represent elevation in the computer • There are three widely used DEM: (1) contour (2) TIN (3) grid • DEM, narrowly defined, refers to gridded form for representing elevation • DEM is data representation, not map display • Understanding DEM is important because it serves as the source of map display (you will create surface map from DEM)
DEM • Data structure for elevation • Representing pyramid… Source: NCGIA
Point data Contour Grid Triangulated Irregular Network (TIN)
Earth’s topography in different data structure Source: Bolstad 2005
How is DEM generated? • 1) From paper map (most common) • Vectorization of contour lines printed on the map (it can be seen as scattered points which has varying elevation values) • If necessary, hydrogrphy features (e.g. river) are added to enhance the quality of DEM • At grid points, elevation values are interpolated from measured points • 2) From photogrammetry • Extraction of elevation from photographs either manually (using stereoplotter) or automatically (using instruments)
TIN • TIN = Triangulated Irregular Network
How is DEM used? • DEM is useful in (1) data storage (2) map display (3) further analysis (e.g. deriving slope, aspect, viewshed, computing least cost path, and much more) • The use of DEM not limited to representing elevation - you can apply the concept of DEM to any continuous surface (statistical surface such as demographic structure, geological profile, and so on)
Where do I obtain DEM? • EROS Data Center • You may have to convert DEM to the format compatible with software (the conversion capability is available in most commercial GIS package) • You can create your own DEM or surface map by interpolating point data provided that the phenomenon is continuous