Download
1 / 30
300 likes | 410 Views
Personal Transit Survey Results. Presented by: Dan Kuzlik Oneida County University of Wisconsin-Extension. Survey Study Partnership. Oneida County University of Wisconsin-Extension, Headwaters, Inc. and the Sokaogon Chippewa Community.

E N D
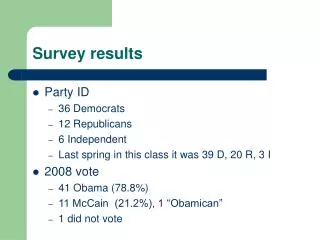
Personal Transit Survey Results Presented by: Dan Kuzlik Oneida County University of Wisconsin-Extension
Survey Study Partnership Oneida County University of Wisconsin-Extension, Headwaters, Inc. and the Sokaogon Chippewa Community
Cool Communities Index Vitality How well is the community? Earning Occupational opportunities Learning Educational access points
Cool Communities Index – - continued - Social Capital Diversity and participation Cost of Lifestyle Price to live After Hours Recharging the battery Around Town Accessibility
Current Reality Lack of walking and bike paths Limited transportation Shuttles to casino and isolated shopping areas Good Airport Lack of information/communication regarding personal transit
Survey was sent to a scientific sample of a random number of households in Forest, Oneida and Vilas Counties.
Mailed 2,300 Surveys. Needed a return of 581 surveys to reach 95% reliability. First mailing: 781 returns
23% 27% 50% County of Residence
Number using an automobile as primary means of transportation.
Miles driven from home to work on a typical day.
Time it takes to drive (one way) to work on a typical day. In Minutes
Time of day you normally leave HOME for workplace AND WORKPLACE for home?
Handicapped members of household requiring transit services. While a 5% figure may appear inconsequential, it indicates there is a need for handicapped-equipped vehicles in any personal transit system.
Would consider using a reliable, inexpensive form of people transit service, if available. NO YES A 52% yes rate indicates strong support for an inexpensive people transit system.
Why members of your household would consider using this service.
So. . .What Have WeLearned? • More than 75% of respondent households have at least 2 drivers. • Categories most given as reasons to use automobiles are: • Shopping/services • Visiting friends/relatives • Health/dental services • Entertainment and/or recreation • Personal business
More than ½ of respondent households had drivers who: • Drive between 12 & 100 miles round trip to work. • Spend 12 minutes to 2 hours commuting to/from work. • Most respondents self-identified that they live near major intersections. • Apparently, nearly all grossly underestimate the cost of driving to work.
More than ½ of respondents said they would consider using reliable, inexpensive transit service. • More than ½ of respondents said they would consider using reliable, inexpensive transit service. • Responses given how they would use it: • Shopping/services • Health/dental services • Entertainment/recreation • Employment • Visiting friends/relatives
Reasons most given why respondents would consider using personal transit service: • High gas prices • High cost of insurance • Do not like to drive in inclement weather • Almost 50% of respondents said they would be willing to pay for a personal transit service.
Thank You University of Wisconsin-Extension Oneida County Office Community, Natural Resource and Economic Development 3375 Airport Road #10 Rhinelander WI 54501 715-365-2750 715-365-2760 (fax) www.uwex.edu/ces/cty/oneida