Download
1 / 22
220 likes | 397 Views
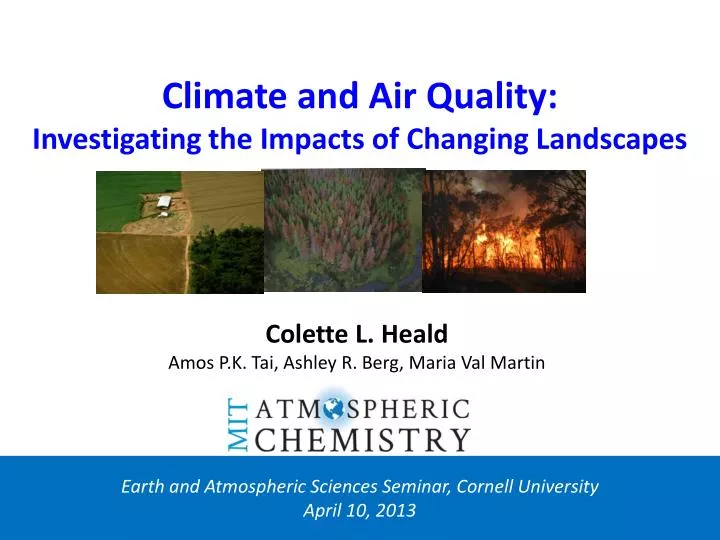
Climate and Air Quality: Investigating the Impacts of Changing Landscapes. Colette L. Heald Amos P.K. Tai, Ashley R. Berg, Maria Val Martin. Earth and Atmospheric Sciences Seminar, Cornell University April 10, 2013. Atmospheric Composition is Linked to Major Environmental Issues.

E N D
Climate and Air Quality:Investigating the Impacts of Changing Landscapes Colette L. Heald Amos P.K. Tai, Ashley R. Berg, Maria Val Martin Earth and Atmospheric Sciences Seminar, Cornell University April 10, 2013
Atmospheric Composition is Linked to Major Environmental Issues AIR QUALITY / HEALTH ACID RAIN VISIBILITY CLIMATE TOXIC ACCUMULATION CROP DAMAGE FERTILIZATION OZONE LAYER
Air Pollution is a Serious and Growing Public Health Issue Number of people living in counties with air pollutant concentrations above EPA Air Quality Standards in 2008 Global premature deaths from environmental risk Fine particulate matter (complex chemical composition) Fine particulate matter [OECD, 2012] Currently over 125 million Americans experience “unhealthy” air. By 2030 AQ surpasses unsafe water as the leading environmental cause of premature deaths.
Reminders from around the World of Linkages Between Air Pollution and Climate Change or Emissions Summer 2010 Fires in Russia Beijing “Airpocalypse” (Winter 2013) Clear Day February 27, 2013 PM concentrations sky rocket. Remain high for several weeks. US Embassy tweets report concentrations “beyond index” above 700 µg/m3 (EPA daily standard is 35 µg/m3). 55,000+ estimated deaths from smog and heatwave
EMISSIONS (natural & anthropogenic) CLIMATE Atmospheric Composition (Air Quality) LAND USE CHANGE (natural & anthropogenic)
Climate Change Alone Degrades Mean Air Quality over Continental Regions: The So-Called “Climate Penalty” 2000-to-2050 change in surface ozone due to climate change alone GISS+GEOS-Chem Ozone is predicted to increase over polluted continental regions (meteorological factors + natural emission changes) and decrease over the ocean (due to enhanced water vapour) as predicted by Wu et al. [2008] and others. Offsets benefits from emissions control. [Tai et al., submitted]
A Critical Factor in the “Climate Penalty”: Isoprene Emissions O3 BUT CO2 inhibits Isoprene Emission! [Possell & Hewitt 2011] Present-day level 2050 level 3 2 Future: NPP ↑, Temperature↑ = Isoprene ↑ Normalized isoprene emission 1 CO2 inhibition implies that isoprene emissions may stay ~ constant [Heald et al., 2009]. Need to revise future air quality projections! Driver for many predictions of increasing ozone, organic aerosol and methane increases [eg. Sanderson et al., 2003; Heald et al., 2008; Shindell et al., 2007] 0 400 800 1200 CO2 concentration (ppmv)
CO2 Inhibition of Isoprene Emissions Reduces Ozone Sensitivity to Climate Change 2000-to-2050 change in surface ozone due to climate change alone In major populated regions, projected ozone increase due to climate change (max +6 ppbv) is reduced by >50% (to max +3 ppbv) due to CO2 inhibition of isoprene emission. Without CO2 effect With CO2 effect With minus without [Tai et al., submitted]
As a Result, Land Use Change and Climate ~Equal Players in Determining Ozone Air Quality 2000-to-2050 change in surface ozone Climate change effect Land use change effect Land use change can offset or reverse in sign the effect of climate change on ozone air quality. Air quality control strategies needs to consider all three of emissions, land use change and climate. 2000-to-2050 change in cropland fraction (IPCC A1B) [Tai et al., submitted]
Climate and Air Quality Impacts on Global Crop Productivity? Illinois heatwave summer 2012 Snap peas damage due to O3 exposure) tolerant sensitive °C Tmax f(cropland area) f(temperature) f(O3 concentration) Thigh [Mills et al. 2007] Tmean Relative Yield based on Butler and Huybers [2013] Tbase Wheat Day since 1 June Ozone exposure (ppm-hour)
Relative Impacts of Climate Change and Ozone Pollution on Wheat Production Under IPCC AR5 RCP8.5, using CESM ozone and climate 2000 global wheat production (103 ton/grid cell) 2050 change due to climate change 2050 change due to ozone pollution 2050 combined production change Large sensitivity in future crop productivity to ozone pollution & climate change (± 25% regionally). Needs to be included along-side land use change and farming practices when considering 21st century food security. [Tai et al. in prep]
Bark Beetle Infestation in Western North America Worst beetle outbreak in recorded history: peaked in BC in 2007 and in the Western US in 2009 Over 100,000 km2 of forest killed, continued expansion. Impacts: carbon cycling, fire susceptibility. What about air quality? [Kurz et al., 2008]
Bark Beetles Perturbing Monoterpene Emissions O3 VOCs? VOCs ↓Mortality Effect ↑Attack Effect Very few quantitative studies have been done Amin et al. (2012; 2013) measure emissions from Lodgepole pine (and spruce) under attack by mountain pine beetle, see significant enhancements of some emissions.
Estimated Impacts on Monoterpene Emissions VEGETATION DISTRIBUTIONS (CLM4) ANNUAL MORTALITY (Meddens et al., 2012) VOC EMISSIONS IN CLM4 (MEGAN2.1) (Guenther et al., 2012) EXPERIMENTAL VOC INCREASES (Amin et al., 2012) Mortality Effect Mortality Effect + Attack Effect 2004 Largest impact of MPB on monoterpene emissions in British Columbia in 2004 (increase up to 70%) and in 2008 in US (increase up to 104%). 2008 β-pinene, β-phellandrene, 3-carene, P-cymene
Estimated Impacts on Secondary Organic Aerosol Formation VEGETATION DISTRIBUTIONS (CLM4) CHAMBER SOA YIELDS (6-55%) (Lee et al., 2006) ANNUAL MORTALITY (Meddens et al., 2012) EXPERIMENTAL VOC INCREASES (Amin et al., 2012) VOC EMISSIONS IN CLM4 (MEGAN2.1) (Guenther et al., 2012) Mortality Effect Mortality Effect + Attack Effect More muted impact on SOA (~30-40% max increases) but also more regional. Dependent on very uncertain species-variable response: scenario using spruce data shows up to doubling of SOA (1 µgm-3 increase). This is comparable to the estimate of “natural” aerosol background implications for achieving EPA Regional Haze Rule Evidence of importance of land use change in air quality. 2004 2008 [Berg et al., 2013]
Bark Beetle Kill in Western US Raising Fire Susceptibility?(links between climate change, land use and air quality) September 11, 2005 BEFORE Grand Lake, CO 5 km September 28, 2011 AFTER Grand Lake, CO High Park fire in Colorado (June 2012) burned in area of 70% beetle-killed trees
2012: Most Destructive Fires in Colorado History, with Air Quality Implications High Park Fire (June 2012) Waldo Canyon Fire (July 2012) PM2.5 at Fort Collins (near High Park Fire) Many local exceedances of daily PM2.5 standard (over 100 µg/m3 measured in Fort Collins!) How often do these events occur?
Decadal Satellite Record Shows Large Aerosol Anomalies Associated with Both Local and Transported Smoke MODIS Terra AOD anomalies June 2002 August 2012 MT, WY, ID, WA Fires CA Station Fire (2009) AZ, CA Fires AZ Wallow Fire (2011) High Park and Waldo Fires Hayman Fire
Vertical Distribution of Wildfire Smoke CALIOP aerosol profile over Colorado Smoke heights measured by MISR satellite for High Park Fire Smoke plumes Smoke clouds Smoke plumes (esp for energetic fires) are injected aloft. But smoke clouds also observed near surface. Air quality impacts depend on whether aerosol reaches surface [val Martin et al., submitted]
Future Smoke Impacts on PM 2050 2000 [Westerling et al, 2007] Future PM2.5 may stay constant over western US due to increased fire activity! Projected annual total biomass burned PM2.5 PM2.5 Fires [Yue et al, submitted] Increased area burned results in ~150% increase in BC and OC fire emissions [val Martin et al., in prep]
A Final Word on Land Use Change: Natural Land Use Change is Highly Uncertain LAI (2100-2000) Same land model (CLM) driven by 8 different climate projections Very sensitive to precip [mm] [Alo and Wang, 2008]
CONCLUSIONS The ozone “climate penalty” is not as severe as previously suggested. Land use change and climate change are equally important in determining near-term air quality (2050). Initial results suggest that both ozone pollution and climate change can substantially impact crop production by 2050. Pine beetle infestation in W North America over the last decade estimated to be responsible for up to 40% increases in SOA. Large uncertainties in emissions response. Smoke from wildfires in the W. US results in both local and regional air quality degradation. Increasing wildfire activity may cancel out emissions control benefits for PM air quality in the W. US. Land use change is the most challenging driver of atmospheric composition to predict, and is a key uncertainty in chemistry-climate projections. Funding Acknowledgements: