Download
1 / 15
150 likes | 288 Views
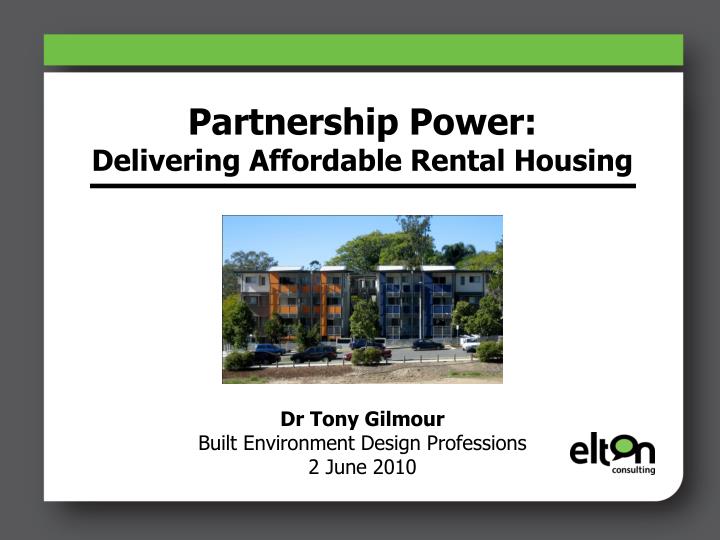
Partnership Power: Delivering Affordable Rental Housing Dr Tony Gilmour Built Environment Design Professions 2 June 2010. Presentation Overview. Background – the brave new world of affordable rental housing Partnerships in action – City West Housing case study

E N D
Partnership Power:Delivering Affordable Rental HousingDr Tony GilmourBuilt Environment Design Professions2 June 2010
Presentation Overview • Background – the brave new world of affordable rental housing • Partnerships in action – City West Housing case study • Conclusion – the power of partnerships
Know Your Social Rental Housing • Public housing run by state agencies • Rents based on 25% household income • Most tenants don’t work • Several high-rise and single tenure estates • Community housing run by non-profits • Rents range from 25-30% household income up to 75% market rent • Virtually all tenants work – ‘key workers’ • Mixed tenure/income neighbourhoods, well designed buildings
Rise of Community Housing Providers • Historically, non-profit community housing (‘housing associations’) dominant – philanthropy, tenant cooperatives etc. • Mid 20th Century pre-eminence of large volume public housing • 1970s+ International trend for state coordination/funding of community housing. Public housing becomes ‘residualised’ • 1980s+ Market forces brought into community housing, and move to mixed funding models internationally (slightly later in Australia) • 1990s+ More complex relationships and partnerships. Stock transfers, joint ventures, use of planning system, ‘nation building’ • Commonwealth Government aims to move community housing shares of social housing from 10% to 35% by 2014
Funding Affordable Rental Housing • National Rental Affordability Scheme (NRAS) launched 2008 with aim to build 50,000 new ‘key worker’ type homes over 5 years • Competitive bidding for funding to encourage best schemes. No allocation quotas per State or Territory – who are the winners? • NRAS available to for-profit and non-profit bidders • Modest level of funding: $8,000 pa for 10 years ($6,000 from Commonwealth, $2,000 State/Territory) • Need for other ‘levers’ to make schemes work – bank loans, land contributions, planning assistance, tax breaks for developers • NRAS encouraging further growth of community housing providers. Coupled with greater regulation, NRAS leading to a more professionally managed and commercial sector
City West Housing – Original Scheme • Non-profit organisation established by NSW Government 1994 to deliver affordable housing in newly-gentrifying Pyrmont/Ultimo • Commonwealth contributed $50m – Better Cities Program. NSW Government adds 4% of local public land sales ($7m) • Developer contributions generated from levy on all commercial and residential schemes in the area under SREP 26. Could be in cash or housing, though in practice all in cash - $14m by 2003 • No on-going subsidy for affordable rental accommodation. Rents set at between 25% and 30% of household income • 450 units produced in area. City West were the largest developers in Australia of new affordable housing until late 2000s • Tenants must live or work in designated areas and earn between $29,094 and $80,180 household income
City West Housing – Capital Costs Higher income tenants, 10% GST exemptions, 7% Developer charges, 10% Land sales levy, 15% Grants, 42% Non-profit tax savings, 16% Source: Milligan et al. (2004)
Zetland Green Square Pyrmont
City West Housing – New Directions • From 1998, City West area of operation spread to Green Square • City of Sydney ‘Green Square Affordable Housing Scheme’ aims for 479 homes for low/moderate income households over 20 years • Uses inclusionary zoning. Either 3% of residential floor area should be affordable housing, or if payment in cash - $121 per square metre (separate levies for non-residential schemes) • Use of National Rental Affordability Scheme (NRAS) incentives
City West Housing – Partnerships • Integrated working between Federal, State and Local Government • Developers involved through use of the planning system, and on project delivery • Design professionals assist masterplanning, environmentally sustainable design etc. • Tenants actively involved in management decision making, especially existing units • Professional board: solicitor, planner, developers, accountant, social policy expert • No links with the main state public housing agency - Housing NSW
Partnership Power • Affordable rental housing delivery increasingly involves partnerships across public, private and non-profit sectors • Use of partnerships for affordable housing mirrors solutions to other ‘wicked’ urban problems – Green Square, Barangaroo, heritage etc. • Move to complex affordable housing delivery models, and integration of housing with other social/economic urban objectives is increasing the role of built environment professionals • Contemporary BEDP staff need a broader range of skills in finance, risk and partnership working, not just core competencies • Increasingly important role of professional bodies, consultants and universities in building and sharing knowledge
Partnership Power:Delivering Affordable Rental HousingDr Tony Gilmourtony@elton.com.auwww.tonygilmour.com