Download
1 / 27
270 likes | 274 Views
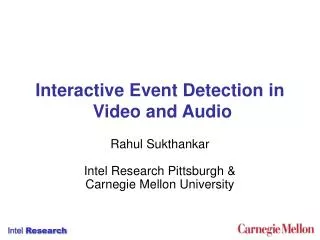
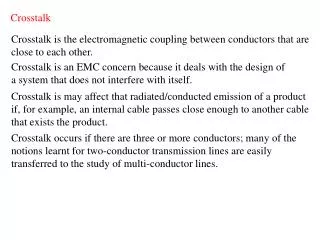
Speech and Crosstalk Detection in Multichannel Audio. Stuart N. Wrigley, Member,IEEE, Guy J. Brown,Vincent Wan,and Steve Renals, Member,IEEE. IEEE TRANSACTIONS ON SPEECH AND AUDIO PROCESSING, VOL. 13, NO. 1, JANUARY 2005. Presenter︰Ting-Wei Hsu. Introduction. Channel 1. Headset Microphone.

E N D
Speech and Crosstalk Detectionin Multichannel Audio Stuart N. Wrigley,Member,IEEE, Guy J. Brown,Vincent Wan,and Steve Renals,Member,IEEE IEEE TRANSACTIONS ON SPEECH AND AUDIO PROCESSING, VOL. 13, NO. 1, JANUARY 2005 Presenter︰Ting-Wei Hsu
Introduction Channel 1 Headset Microphone Channel 2 A Channel 3 B C Meeting Table Describing two experiments related to the automatic classification of audio into four classes. Speech Lab. NTNU
Introduction (cont.) The first experiment attempted to optimize a set of acoustic features for use with a Gaussian mixture model (GMM) classifier. GMM eHMM The second experiment used these features to train an ergodic hidden Markov model classifier. Goal: 1. Producing accurate labels (accuracy : 96%) 2. Indicating if the local speaker (S) is active. Speech Lab. NTNU
Outline • Detection Crosstalk : Previous approaches • Detection Crosstalk : Ergodic hidden Markov model (eHMM) • Acoustic Features • Statistical Framework • Experiments • Feature Selection Experiments • Multistream eHMM Classfication Experiments • Evaluation Using ASR Speech Lab. NTNU
Detection Crosstalk : Previous approaches • Higher-order statistics • LeBlanc and de Leon used signal kurtosis to discriminating overlapped speech from nonoverlapped speech. • Signal processing techniques • Morgan et al.proposed a harmonic enhancement and suppression system for separating two speakers. (stronger and weaker) • Krishnamachari et al.proposed spectral autocorrelation peak valley ratio (SAPVR). • Statistical pattern recognition • Zissman et al.trained a Gaussian classifier using mel-frequency cepstral coefficients (MFCCs). These approaches attempt to identify only two speakers are active. Speech Lab. NTNU
Detection Crosstalk : eHMM • Pfau et al.proposed a detector using an ergodic hidden Markov model (eHMM). • The eHMM consisted of four states — S, SC, C and SIL. • Each state was trained using features such as critical band loudness values, energy, and zero-crossing rate. A Short-time cross-correlation is computed to assess similarity. B For each pair which exhibited high similarity (i.e., the same speaker was active in both channels), the channel with the lower energy was assumed to be crosstalk. Multi speakers C Speech Lab. NTNU
Acoustic Features • A. MFCC,Energy,and Zero Crossing Rate • B. Kurtosis • C. Fundamentalness • D. Spectral Autocorrelation Peak-Valley Ratio (SAPVR) • E. Pitch Prediction Feature (PPF) • F. Features Derived From Genetic Programming • G. Cross-Channel Correlation • Each feature is used to analyzing the differences • between isolated and overlapping speech. Speech Lab. NTNU
A. MFCC,Energy,and Zero Crossing Rate • MFCC features for 20 critical bands up to 8 kHz were extracted. • The short-time log energy and zero crossing rate (ZCR) were also computed. Speech Lab. NTNU
B. Kurtosis • Kurtosis is the fourth-order moment of a signal divided by the square of its second-order moment. • It has been shown that the kurtosis of overlapping speech is generally less than the kurtosis of isolated speech utterances. Speech Lab. NTNU
C. Fundamentalness • Kawahara et al. describe an approach to estimating the “fundamentalness” of an harmonic. • If more than one fundamental is present, interference of the two components introduces modulation, thus decreasing the fundamentalness measure. Dual speaker Single speaker Speech Lab. NTNU
D. Spectral Autocorrelation Peak-Valley Ratio • Spectral autocorrelation peak-valley ratio (SAPVR) is computed from the autocorrelation of the signal spectrum obtained from a short-time Fourier transform. • When more than one speaker is active simultaneously, the autocorrelation function becomes flatter due to the overlapping harmonic series. Speech Lab. NTNU
E. Pitch Prediction Feature (PPF) • Steps: • Computing 12th-order linear prediction filter coefficients (LPCs). • Using LPCs to calculate the LP residual (error signal). • Defining the standard deviation of the distance between successive peaks. • If a frame contains a single speaker, a regular sequence of peaks will occur in the LP residual which correspond to glottal closures. Therefore, the standard deviation of the interpeak differences will be small. Speech Lab. NTNU
F. Features Derived From Genetic Programming A genetic programming (GP) approach was also used to identify frame-based features that could be useful for signal classification. The GP engine identified several successful features, of which three were included in the following feature selection process : GP1 : rms(zerocross(abs(diff(x)))) GP2 : max(autocorr(normalize(x))) GP3 : min(log10(abs(diff(x)))) ← MATLAB functions Speech Lab. NTNU
G. Cross-Channel Correlation For each channel i , the maximum of the cross-channel correlation at time between channel j and each other channel was computed (1) : correlation lag : signal from channel i : signal from channel j : window size : Hamming window Speech Lab. NTNU
G. Cross-Channel Correlation (cont.) • Two normalization way : • The feature set for channel i was divided by the frame energy of channel i. • Spherical normalization, in which the cross correlation is divided by the square-root of the autocorrelations for channels i and j plus some nonzero constant to prevent information loss. Speech Lab. NTNU
Statistical Framework • The probability density function p(x) of each four state in eHMM is modeled by a Gaussian mixture model (GMM). • Each GMM was trained by Expectation-maximization (EM) algorithm. • The likelihood of each state k having generated the data at time frame t is combined with transition probabilities to determine the mostly likely state (2) (3) Speech Lab. NTNU
Statistical Framework (cont.) • Set some transition constraints • When considering m observations (audio channels), the state space contains all permutations of : • S(m-1)C • qSCnC • mSIL , where 2 <= q <= m and n = m - q • Reducing the size of the state space. Speech Lab. NTNU
Statistical Framework (cont.) • We base our feature selection approach on the area under the ROC curve (AUROC) for a particular classifier. • Using the sequential forward selection (SFS) algorithm to computes the AUROC for GMM classifiers trained on each individual feature. • The feature set resulting in the highest AUROC is selected. Speech Lab. NTNU
Statistical Framework (cont.) • Sequential Forward Selection (SFS) Algorithm • In this experiments, the SFS algorithm always terminated with fewer than six features for all crosstalk categories. CF : critical function Speech Lab. NTNU
Experiments • Feature Selection Experiments • Multistream eHMM Classfication Experiments Speech Lab. NTNU
Feature Selection Experiments • Individual feature performance for each classification category. • Values indicate the percentage of the true positives at equal error rates. Speech Lab. NTNU
Feature Selection Experiments (cont.) • The feature sets derived by the SFS algorithm were selected. • The under four pictures indicate the ROC performance curves for each crosstalk category’s optimum feature set. • Diagonal lines indicate equal error rates. • Dashed curves indicate performance when log energy is excluded from the set of potential features. • For equal false positive and false negative rates, the performance of each classifier is approximately 80%. Speech Lab. NTNU
Multistream eHMM Classfication Experiments This experiment used features to train an ergodic hidden Markov model classifier. The eHMM classification performances are shown : 1.High true positive rate 3.Poor recording 2.Relative Upper-line : True Positive Rate Lower-line : False Positive Rate Speech Lab. NTNU
Multistream eHMM Classfication Experiments (cont.) Two applications for such a classification system are speech recognition preprocessing and speaker turn analysis. Both of these rely on accurate detection of local speaker activity, which is largely equivalent to the speaker alone (S) channel classification. These applications require the accurate classification of contiguous segments of audio. The segment-level performance is similar to that of the frame-level approach. Speech Lab. NTNU
Evaluation Using ASR Segment and ASR word accuracies on whole meetings: Ehe eHMM classifier has a segment recognition accuracy of between 83% and 92% for single speaker detection. The results indicate that the eHMM classifier is capable of detecting most of the frames required for optimal ASR. Voice activity detector emphasizes on energy. Speech Lab. NTNU
Evaluation Using ASR (cont.) ASR performance for meetings bmr001, bro018, and bmr018. Note that the VAD classifier failed on a number of channels and hence, some data points (channels 0 and 8 from bmr001 and channel 8 from bmr018) are missing. The inconsistent VAD ASR results emphasise that an energy based measure for speaker detection is highly unreliable. Speech Lab. NTNU
Thank You! Speech Lab. NTNU