Download
1 / 37
390 likes | 566 Views
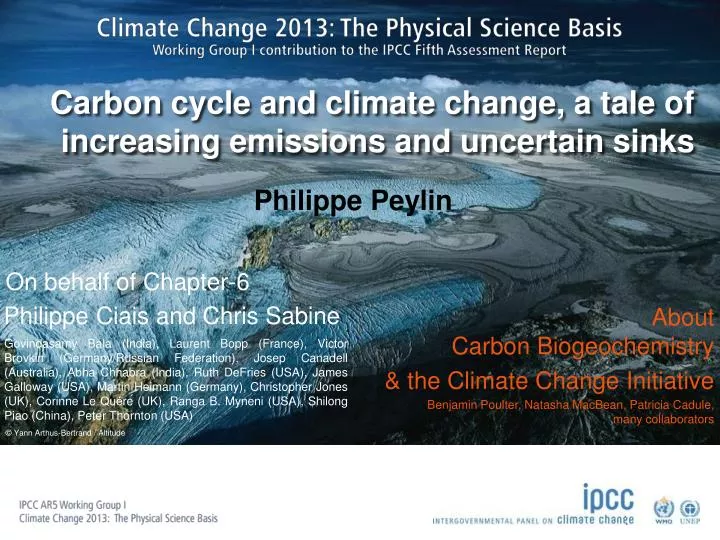
Carbon cycle and climate change, a tale of increasing emissions and uncertain sinks. Philippe Ciais and Chris Sabine. O n behalf of Chapter-6. About Carbon Biogeochemistry & the Climate Change Initiative Benjamin Poulter , Natasha MacBean , Patricia Cadule , many collaborators.

E N D
Carbon cycle and climate change, a tale of increasingemissions and uncertainsinks Philippe Ciais and Chris Sabine On behalf of Chapter-6 About Carbon Biogeochemistry & the Climate Change Initiative Benjamin Poulter, Natasha MacBean, Patricia Cadule,many collaborators Philippe Peylin Govindasamy Bala (India), Laurent Bopp (France), Victor Brovkin (Germany/RussianFederation), Josep Canadell (Australia), AbhaChhabra (India), Ruth DeFries (USA), James Galloway (USA), Martin Heimann (Germany), Christopher Jones (UK), Corinne Le Quéré (UK), Ranga B. Myneni (USA), ShilongPiao (China), Peter Thornton (USA)
Never forgetthis : CO2remains in the atmosphere long afteremissions
CO2, CH4 and N2O increase in the IndustrialEra CO2 CH4 N2O Icecore records Atmospheric monitoring
Global Carbon Budget Since 1750, human activities have emitted 555 ± 85 PgC from fossil fuel burning and land use change Fossil fuel CO2 emissions were 9.5 PgC yr-1 in 2011, 54% above their 1990 level On average over the past 50 years, a fraction of 44 ± 6 % of emissions remains in the atmosphere, increasing the Earth’s greenhouse effect
Current land / oceancarbon flux anomalies(fromatmospheric CO2 inversion) Global North Hemis. Tropics South Hemis.
Comparison of CMIP5 Land/Ocean C fluxes with GCP Ocean C flux(PgC/yr) LandC flux(PgC/yr) Chapter - 9
Concentration driven Emission driven Policy relevant objectives Free running coupledclimate – carbon system Used in AR5 : CMIP5 Used in AR4 :C4MIP Projecting future changes withEarth System Models
Historical Simulatedhistoricaland future land and oceancarbonstorageusing CMIP5 models RCP future pathways Very large uncertainty on projected changes in land carbonstorage
Uncertainties in modeled land and oceancarbonstorage translate intouncertain compatible emissions Compatibleemissions for the RCP pathways
Climate response to CO2 (K / ppm) Sinks response to CO2 (PgC/ ppm) Positive carbonclimate feedbacks confirmed in AR5 Sinksresponse to climate (PgC / K) Climate change will affect carbon cycle processes in a waythatwillexacerbate the increase of CO2in the atmosphere (high confidence)
Response to atmospheric CO2 only land ocean decreasing sink increasing sink source: Ciais et al. 2013 IPCC AR5
Response to climate change only land ocean models do not include the release of permafrost C decreasing sink increasing sink source: Ciais et al. 2013 IPCC AR5
Surface pH Ocean acidification Surface pH change in 2090s from 1990s Uptakeof carbonwillincreaseoceanacidification: Virtually certain Aragonite vulnerable in parts of the Arctic& somecoastal upwelling systemswithin 1 decade, in parts of the SouthernOceanwithin1-3 decades Further research need: How will ocean acidification affect marine ecosystem services?
Ocean O2 content change (%) Ocean de-oxygenation Surface O2 change in 2090s from 1990s Further research need: How will ocean deoxygenation affect marine ecosystem services? Further research need: How will ocean deoxygenation affect marine ecosystem services?
Future of the assessment : land-use emissions scenarios & evaluation Land use emissionswere not separatedfrom net land flux in ESM for CMIP5 All RCP pathways have low land use emissions
Future of the assessment : land-use emissions scenarios & evaluation Deforestation rate (103 km2 / yr) Researchneeds:Understanddifferencesbetween global and regional land use scenariosReconcilefoodsecurity scenarios (MA, FAO) withclimatescenarios (IPCC) Green : RCP8.5 scenario over Amazon Blue & Orange : Brazilian projections (LUCCME in blue and SIMAMAZONIA) SoaresFilho et al., 2006
Future of the assessment : land-use emissions scenarios & evaluation Deforestation rate (103 km2 / yr) Researchneeds:Understanddifferencesbetween global and regional land use scenariosReconcilefoodsecurity scenarios (MA, FAO) withclimatescenarios (IPCC) Green : RCP8.5 scenario over Amazon Blue & Orange : Brazilian projections (LUCCME in blue and SIMAMAZONIA) SoaresFilho et al., 2006
Future biomassC storage Offline model withN & P limitations Future of the assessment:Nutrient limitation on terrestrial C storage Future soil C storage Only1-2Earth SystemModelsincluded N-limitations in CMIP5 and found a smallersinkresponse to CO2 and climate Goll et al. 2012
Evaluation of C-N 11 terrestrialmodelsusing Free-Air CO2 Enrichementexperiment : Net Primary Production NPP(controlCO2) Observed Models NPP(doubleCO2) Zaehle et al. 2014
Temperature CH4 Future of the assessment:CH4 and N2O climate feedbacks Feedbacks thatwere not included in CMIP5 models: Climatesensitivity of wetland CH4emissions Stability of ocean CH4 hydrate pools Response of soil N2O emissionprocesses to climate and elevated CO2 Response of ocean N2O emissions to changes in O2 & circulation
1670Pg C In permafrost Future of the assessment: ‘cold’ carbonprocesses, permafrost C Mc Dougall et al. 2013 An EarthSystem Modelwith permafrost carbonprocesseswasdriven by RCP emissions Result: higherprojectedwarming (0.13 to 1.7°C) and CO2 release (70 to 500 PgC) Key « missing » processes : soilice, soil C vertical distribution, soil C pools decomposition rates [C:N], fire& thermokarst
Sensitivity analysis with 1 ESM (HadCM3 – SRES-A1B) varying Atmospheric physics parameters Terrestrial carbon cycle parameters Carbon vs physicalparametersuncertainty Booth et al. 2012
Links with CCI projects ? • Models need to be evaluated / optimized(especial for critical “long term C-cycle” processes) • Need comprehensive global data-sets • Need monitoring strategies to monitor Carbonfluxes and stocks • Need coherent data sets linking Carbon, Water, other nutrients cycles
Need for more atmospheric CO2 data ! Regional fluxes from atmospheric CO2 inversions (flux annomaliesPgC/yr) N. America Europe N. Asia
Need for more atmospheric CO2 data ! Regional fluxes from atmospheric CO2 inversions (flux annomaliesPgC/yr) N. America • Potential of satellite data: • in-situ network maybelimited • Largepotential of satellite data but « any biais» iscritical! Europe CCI-GHG project N. Asia
Land cover and land cover management ! New land cover map (CCI) Old Olson land cover Map • Significant impact on the simulatedatm [CO2] at Point Barrow Land surface model(ORCHIDEE) LAI Diff : CCI - Olson Atmospherictransport model
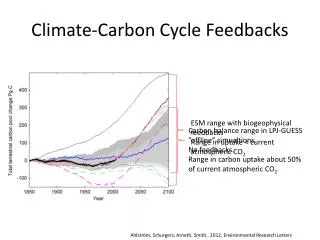
Crucial need to monitor forest biomass content ! • IPCC model uncertainties are not decreasing 4th IPCC (2005 5th IPCC (2012) GCP-Reccap (2013) <- 400 Pg C range of uncertainty -> • NeedBiomass data to validateglobal model simulations • CurrentestimatesfromRemoteSensingstillneed to beimproved ! (Note: paperin review in GEB : “Markedly divergent estimates of Amazon forest carbon density from ground plots and satellites”)
Comparison of CMIP5 land C stocks with “ref data” ? Reference Vegetation Carbon (PgC) Soil (+ litter) Carbon (PgC) Anav et al. 2013
Data Assimilation to better constrain model parameters Satellite NDVI Assimilation into LSM (ORCHIDEE) Parameter optimisation Atmos. Conc. Flux Tower “CMIP5 – RCP8.5” • Potential large decrease of land carbon storage (mainly from soil)
Few good guys CO2fertilization of NPP (-) CO2drivenoceanuptake (+) Longer northerngrowingseasons (+) Land management (-) (-/+) Level of understandingin parenthesis Manypotentiallybadguys Intense land use scenarios (- -) Permafrost C emissions (- -) Wetlandemissionsincrease (- -) Fireemissionsincrease (- -) EmergingNutrientlimitations (- -) ? Conclusions, future challenges ??? CCI should focus on data stream to inform on the « long-term » carbon cycle…
Case of Amazon forest potential dieback • Remote sensing observations informed modelers to consider: • Depth of tropical soils • Rooting strategies • Leaf cycle and shedding • Forest mortality and drought • Species diversity • New remote sensing approaches are needed: • Sentinels and BIOMASS missions • Higher temporal frequency • Cloud/aerosol treatment • Spatial resolution • Microwave spectral resolution
Case of boreal forest changes • 5-13 day increase in onset of boreal growing season • Boreal forest browning detected in satellite and plotmeasurements • DGVM models agree with satellite trends in growing season length • But high disagreement in LAI dynamics Bunn 2007
For more insights on land / ocean model simulations andatmospheric inversions: http://www.globalcarbonatlas.org/ Thank you for your attention
Positive carbon-climate feedbacks meansless compatible emissions