Download
1 / 1
10 likes | 112 Views
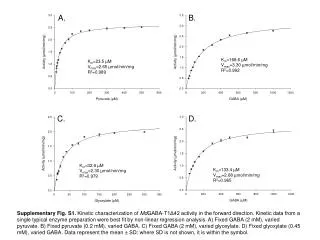
Fig. S2. P1. P2. P3. 23.0. slope: -3.076 Intercept: 21.336 R2: 0.999. slope: -3.235 Intercept: 18.389 R2: 0.992. slope: -3.403 Intercept: 21.734 R2: 0.999. 24.5. 23.5. 18.0. 18.5. 17.5. Ct. 13.5. 12.5. 12.0. 2. -1. 0. 1. 3. -1. 0. 1. 2. 3. 2. -1. 0. 1. 3. L1.

E N D
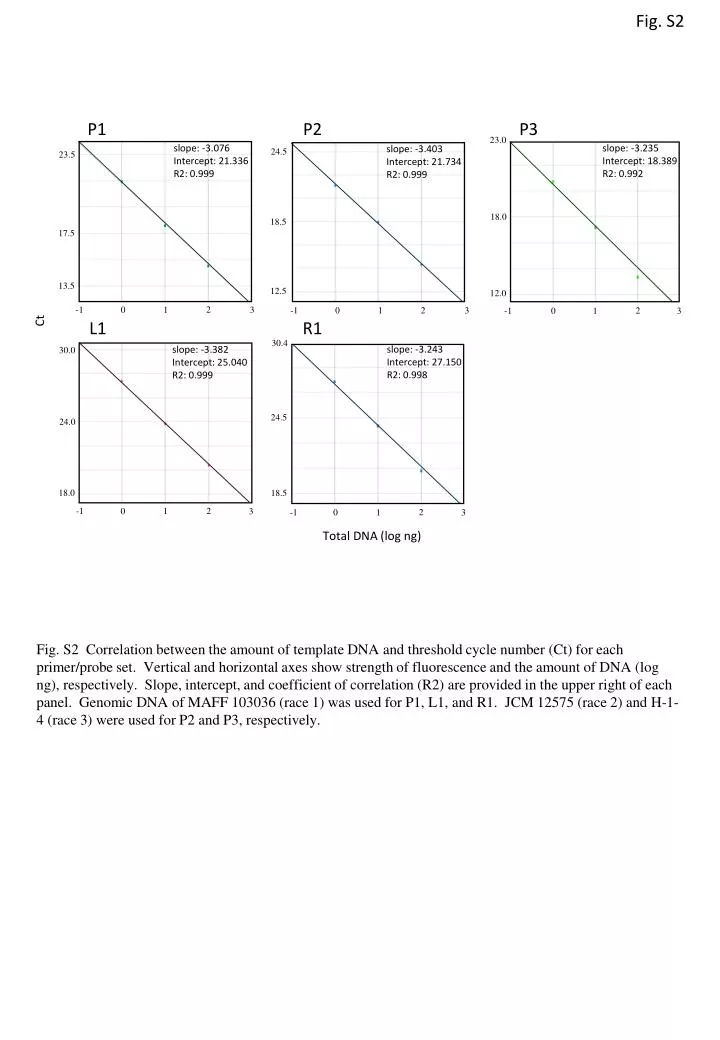
Fig. S2 P1 P2 P3 23.0 slope: -3.076 Intercept: 21.336 R2: 0.999 slope: -3.235 Intercept: 18.389 R2: 0.992 slope: -3.403 Intercept: 21.734 R2: 0.999 24.5 23.5 18.0 18.5 17.5 Ct 13.5 12.5 12.0 2 -1 0 1 3 -1 0 1 2 3 2 -1 0 1 3 L1 R1 30.4 slope: -3.243 Intercept: 27.150 R2: 0.998 slope: -3.382 Intercept: 25.040 R2: 0.999 30.0 24.5 24.0 18.0 18.5 -1 1 2 0 3 2 -1 0 1 3 Total DNA (log ng) Fig. S2 Correlationbetween the amount of template DNA and threshold cycle number (Ct) for each primer/probe set. Vertical and horizontal axes show strength of fluorescence and the amount of DNA (log ng), respectively. Slope, intercept, and coefficient of correlation(R2)are provided in the upper right of each panel. Genomic DNA of MAFF 103036 (race 1) was used for P1, L1, and R1. JCM 12575 (race 2) and H-1-4 (race 3) were used for P2 and P3, respectively.