Download
1 / 50
510 likes | 748 Views
Lightness, Brightness and Contrast. Week 3 :CCT370 – Introduction to Computer Visualization. The Big Picture (again). Ecological optics/perception Gibson Perception is in service of action For evolutionary (survival) advantage See/perceive things that allow action

E N D
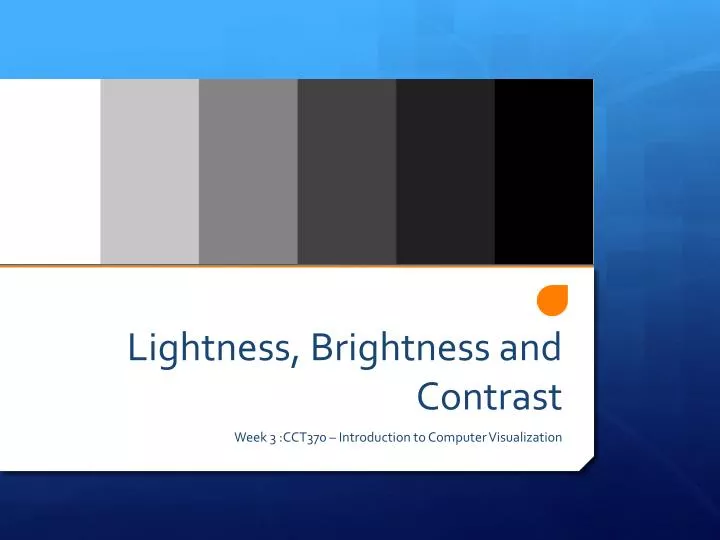
Lightness, Brightness and Contrast Week 3 :CCT370 – Introduction to Computer Visualization
The Big Picture (again) • Ecological optics/perception • Gibson • Perception is in service of action • For evolutionary (survival) advantage • See/perceive things that allow action • E.g., surfaces for walking on, objects for interacting with, … • Leads to (visual) system that: • Does extract “elementary” elements to use in perception • Features • Stage 1 • Basis of sensory systems • AND interaction throughout system leads to perception • Stages 2 and 3
Unfortunately … • This evolutionarily derived system has pitfalls • Especially when used with various electronic media • Which is what we are concerned with! • E.g., to see objects need to find edges ... • But, in effect “oversee” edges, e.g., Mach band • And other things …
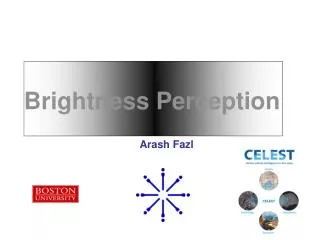
Simultaneous Brightness Contrast • Gray patch on dark background looks lighter than same patch on light background
Saw “Overdection” in GC • Flat shading “looks worse than is…” • Mach banding at polygon edge for flat shading
Black spots appear at intersections of bright lines Couple of other things going on here … Hermann Grid Illusion
So, … • What perceived is NOT what is there! • Here, perceived edges, discontinuities, … • … and flashing dots (for heaven’s sake)! • That way for evolutionary reasons • System to detect edges … • For forming boundaries among things, to perceive objects • … and in general work well • We’ve just been pushing systems boundaries • Finding places where fail • Important to know where, and how, fails for designing visualizations • At core of explanation is that “neurons detect differences” • … as Ware says • Will examine how neurons work • ~Feature extraction
Overview • Neurons detect differences … • … and inhibit, as well as excite • And are connected to many others, …., as we’ve discussed • Neurons, receptive fields, and brightness illusions • Hermann grid, Mach bands, simultaneous brightness contrast • Contrast effects and artifacts in cg • Lots of illustrations to complement theory • Edge enhancement • Luminance, brightness, and lightness • Physical energy, and perceived reflectance/color • Perception of surface lightness
Neurons Detect Differences • Last time, saw that receptors act as transducers • Changing energy or chemicals to nerve signals • In fact, receptors transmit signals about relative (vs. absolute) amount of energy, e.g., light • How light differs from one receptor to another • How light has changed in past instant • Ware: • “Neurons in the early stages of the visual system do not behave like light meters; they behave like change meters.” • Implication is that visualization not good for measuring absolute numerical values, but rather for displaying patterns of differences or changes over time • Again, nature of visual system leads to “errors” • Especially in computer graphics
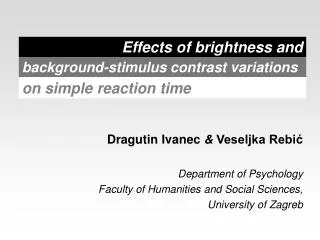
Visualization and Neurology • Main point of today is that as visualization designers we should: 1. At least be “sensitive” to the occurrence of these errors 2. As possible, be able to specify the conditions under which they occur • Below – gravitational field • Neurologically detecting difference leads to Mach banding and contrast errors
In fact, considerable processing of information in eye itself Several layers of cells culminate in retinal ganglion cells Recall, n retinal cells into ganglion cells differs, as f (distance) fovea Reception of retinal cells is by fields of neurons Ganglion cells send information through optic nerve to lateral geniculatenucleus Then, on to primary visual processing areas at back of brain, visual cortex Neurons, Receptive Fields, and Brightness Illusions
Receptive field of a cell: Visual area over which cell responds to light Patterns of light falling on retina influence way neuron responds Even though may be many synapses removed from receptors Retinal ganglion cells organized with circular receptive fields that are either (1) on-center or (2) off-center Cells are firing constantly 1. For on-center (from baseline firing rate): When stimulated in center of its receptive field, it emits pulses at greater rate When stimulated outside center of field, emits pulses at lower rate Inhibitory effect of edge 2. For off-center, the opposite Receptive Fields A. Receptive field structure of on-center cell B. Response in activity of array of on-center cells to being stimulated by a bright edge - Output of system: Enhanced response on bright side of edge - Cell fires more on bright side because there is less light in inhibitory region, hence less inhibited Depressed response on dark side of edge Intermediate to uniform areas on either side of edge C. Smoothed plot of activity level
Again, 1. For on-center (from baseline firing rate) When stimulated in center of its receptive field, it emits pulses at greater rate When stimulated outside center of field, emits pulses at lower rate Inhibitory effect of edge And, can be on-center-off-surround or off-center-on-surround Receptive Fields – Another Graphical View
Demo • DoG in Photoshop
Receptive fields distributed across retina (and overlap) Work simultaneously to “enhance” and “suppress” rate of firing of collection of receptors in the field Center-surround Receptive Fields Act as edge detectors more than level detectors A: mid-low B: Lowest C: Highest D: mid-high Center-surround Receptive Fields
Black spots appear at intersections of bright lines There is more inhibition at points between two squares Hence, they seem brighter than at the points at the intersection Hermann Grid Illusion
Black spots appear at intersections of bright lines There is more inhibition at points between two squares Hence, they seem brighter than at the points at the intersection Hermann Grid Illusion with Receptive Fields
Gray patch on a dark background looks lighter than the same patch on a light background Simultaneous Brightness Contrast
Background removed! (honest, no change in foreground) Simultaneous Brightness Contrast
Same phenomenon, again Simultaneous Brightness Contrast
Gray patch on a dark background looks lighter than the same patch on a light background Predicted by DOG model of concentric opponent receptive fields Simultaneous Brightness Contrast
At point where uniform area meets a luminance ramp, bright band is perceived Said another way, appear where abrupt change in first derivative of brightness profile Simulated by DOG model Particularly a problem for uniformly shaded polygons in computer graphics Hence, various methods of smoothing are applied Mach Bands Ernst Mach
Point where uniform area meets luminance ramp, bright band is perceived Another way, appear where abrupt change in 1st derivative of brightness profile Simulated by DOG model Particularly a problem for uniformly shaded polygons in computer graphics Hence, various methods of smoothing are applied Mach Bands and Receptor Fields, 1
With sequence of gray bands, bands appear darker at one edge than another Simulated by application of DOG model Again, “over-detection” of differences The Chevreul Illusion
Again The Chevreul Illusion
The Chevreul Illusion • Pixel arrays used in rendering
The Chevreul Illusion • At different iterations
Contrast effects are clear Overestimate differences as edges Even see things that aren’t there! Lead to errors of judgment in extracting information from visual displays Gray scales, or any continuous tone, in particular lead to such errors E.g., gravitational map, error in extracting information of 20% of entire scale Simultaneous Contrast and Error
Simultaneous Contrast and Error • Contrast effects are clear • Overestimate differences as edges • Even see things that aren’t there! • Lead to errors of judgment in extracting information from visual displays • Gray scales, or any continuous tone, in particular lead to such errors • E.g., gravitational map, error in extracting information of 20% of entire scale
As noted, for computer graphics Consequence of Mach bands, etc. for shading algorithms At best loss of “realism”, at worst perception of patterns at edges Shading of facets (polygons) Uniform 1 value for a polygon Gouraud Value for edges Average of surface normals at boundaries where facets meet Interpolated between boundaries Still discontinuity at at facet boundaries (edges) Phong Surface normal interpolated between edges No Mach banding Contrast Effects and Artifacts in CG Actual light Perceived/DOG
Lateral inhibition Can be considered 1st stage of an edge detection process Signals positions and contrasts of edges in environment Result is that “pseudo-edges” are formed Cornsweet effect 2 areas that physically have same brightness can be made to look different by having an edge that shades off gradually to the 2 sides Brain does perceptual interpolation, so that entire central region appear lighter than surrounding regions Edge Enhancement: Cornsweet Effect
Cornsweet in action! • This is a more extreme example of the Cornsweet effect. The top and bottom greys are the same shade of grey. I didn't believe that myself when I first saw this image. To prove the point, I extended the grey areas as shown below.
Cornsweet in action! • Hold your hand over the image on your computer screen so that you can only see the grey bands on the left on their own.
Also used by artists Limited dynamic range of paint Important to make objects distinct Seurat Signat notes: Observance of the laws of contrast, methodical separation of the elements (light, shadow, local color, reactions) Visualization, generally Adjust background Make object stand out Edge Enhancement: Art and Visualization
Bathing at Asnieres Edge Enhancement: Seurat
La Grande Jatte Edge Enhancement: Seurat
Luminance, Brightness, Lightness • Ecologically, need to be able to manipulate objects in environment • Information about quantity of light, of relatively little use • Rather, what need to know about its use • Human visual system evolved to extract surface properties • Loose information about quantity and quality of light • E.g., experience colored objects, not color light • Color constancy • Similarly, overall reflectance of a surface • Lightness constancy
Luminance, Brightness, Lightness • Physical • Luminance • Number of photons coming from a region of space • Perceptual: • Brightness • Amount of light coming from a glowing source • Lightness • Reflectance of a surface, paint shade • Consider physical stimulus and perception • Luminance • Amount of light (energy) coming from region of space, • Measured as units energy / unit area • E.g., foot-candles / square ft, candelas / square m • Physical • Brightness • Perceived amount of light coming from a source • Here, will refer to things perceived as self-luminous • Lightness • Perceived reflectance of a surface • E.g., white surface is light, black surface is dark
Amount of light (energy) hitting the eye To take into account human observer: Weighted by the sensitivity of the photoreceptors to each wavelength Spectral sensitivity function: E.g., humans about 100 times less sensitive to light at 450nm than at 510nm Note, use of blue for detail, e.g., text, not seem good Compounded by chromatic aberration in which blue focuses at different point Later, will examine difference cone sensitivities Luminance
Text: at least 3:1 10:1 preferred Generalizes to data Detection of detail requires more contrast Finer Detail Requires More Luminance Difference More detail -> More Contrast
Brightness • Perceived amount of light coming from a glowing (self-luminous) object • E.g., instruments • Perceived brightness very non-linear function of the amount of light • Shine a light of some intensity on a surface, and ask an observer, “How bright?” Intensity = How bright is the point?” 1 1 4 2 16 4 - Steven’s power law Intensity -> Perceived ^ Brightness |
Brightness – Power Law • Stevens power law • Perceived sensation, S, is proportional to stimulus intensity, I, raised to a power, n • S = I n • Here, Brightness = Luminancen • With n = 0.333 for patches of light, 0.5 for points • Applies only to lights in relative isolation in dark, so application more complicated • Applies to many other perceptual channels • Loudness (dB), smell, taste, heaviness, force, friction, touch, etc. • Enables high sensitivity at low levels without saturation at high levels Intensity -> Perceived ^ Brightness |
Monitor Gamma • Monitors in fact emit light in amounts that are not linearly related to the voltage driving them • Historically, effort of early television engineers to most efficiently use availablebandwidth • Exploits non-linearity of human perception • Attempt to make linear change in voltage map for more closely to linear perceptual difference • Luminance = Voltage g • g is monitor gamma • L ranges from 1.4 through 3 • L=3 cancels n=0.33 Stevens’ function: • Brightness ~ (Voltage3)0.33 ~ Voltage • Precise control of luminance requires careful monitor measurement and calibration • Can adjust on many monitors, as well as other corrections
Applicability Monitor calibration • http://www.youtube.com/watch?v=uEZxl_IM7FQ
Amazing and high survival value Factor of 10,000 difference: sunlight to moonlight Still can identify different-brightness materials Absolute amount of light from surface irrelevant Adaptation to change in overall light level Overall level of illumination “factored out” Allows relative changes in an environment to be perceived Factor of 2 hardly noticeable Iris opens and closes (small effect) Receptors photobleach at high light levels (large effect) Can take time to regenerate when entering dark areas Eventually switch to rods Adaptation: Overall Light Level 50 lux interior to 50,000 lux bright sunlight
Various constancies One is lightness constancy Easy to tell which piece of paper is gray and which white White paper is lighter relative to its background Desk color is constant Contrast of object with background provides cue for accurate perception Contrast and Constancy
Perception of surface lightness, and lightness constancy depends on: Adaptation and contrast, as noted Direction of illumination and surface orientation E.g., white surface turned away from light source reflects less light than if turned toward light Lightest object in scene serves as “reference white to determine gray values of other objects Cf., lightness scaling formulas Ratio of specular to nonspecular reflection E.g., everything black vs. white, specular cues Perception of Surface Lightness
Next class • Visualization Context: Colour • Readings: • Ware, Chapters 3 • Michel Foucault, This Is Not A Pipe, Chapter Two: The Unraveled Calligram (1983). • Today in lab: • Fundamental Techniques in Photoshop CS4