Download
1 / 56
1.39k likes | 2.99k Views
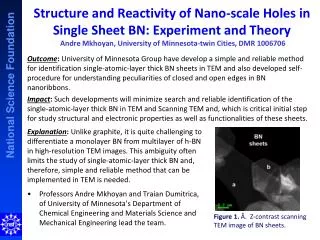
Contrast in TEM and STEM. Amplitude and Phase contrast. TEM. STEM. TEM. STEM. Amplitude contrast and Phase-contrast images. The electron wave can change both its amplitude and phase as it traverses the specimen Gives rise to contrast.

E N D
Contrast in TEM and STEM Amplitude and Phase contrast
TEM STEM
TEM STEM
Amplitude contrast andPhase-contrast images The electron wave can change both its amplitude and phase as it traverses the specimen Gives rise to contrast Si We select imaging conditions so that one of them dominates. SiO2 Al2O3 Ag
Objective aperture BF image DF image HREM image Size of objective apertureBright Field (BF), Dark Field (DF) and High Resolution EM (HREM) Amplitude/Diffraction contrast Phase contrast
BF–DF in STEM BF-DF in TEM mode A B Collects only electrons scattered more than 50 mrad (~3o). Intensity: Z-dependent. Diameters of the Fischione HAADF detector: 4- 28 mm. Collects Bragg electrons
The effect of varying the camera length (L) in STEM mode Varying the camera length (L) corresponds to varying the size of an objective aperture in the TEM mode! STEM DF images are formed by collecting most of the scattered electrons on the ADF detector The collection angle of the detector depend on L
The effect of varying the camera length (L) in STEM mode Varying the cameralength (L) correspond to varying the size of an objective aperture in the TEM mode! STEM DF images are formed by collecting most of the scattered electrons on the ADF deteector The collection angle of the detector depend on L
Amplitude Contrast • Difference in intensity of two adjacent areas: The eyes can not see intensity differences < 5-10%. However, contrast in images can be enhanced digitally. NB! It is correct to talk about strong and weak contrast, but not bright and dark contrast (dark and bright refers to density (number/unit area) of electrons hitting the screen/detector)
Amplitude Contrast • Difference in intensity of two adjacent areas: The eyes can not see intensity differences < 5-10%. However, contrast in images can be enhanced digitally. Si ITO EFTEM (16 eV): Bright = Si
Amplitude Contrast Two principal types Diffraction contrast Mass-thickness contrast -In crystaline materials -Primary contrast source in amorphous materials -Coherent electron scattering (atoms does not scatter independently) -Assume incoherent electron scattering (atoms scatter independently) Both types of contrasts are seen in BF and DF images -Can use any scattered electrons to form DF images showing mass-thickness contrast -Two beam to get strong contrast in both BF and DF images. In TEM and STEM mode
Rutherford Scattering • Mass thickness contrast arises from incoherentelasticscattering • (Rutherfordscattering) • Peaked in the forward direction in thin samples • t and Z-dependent Differential cross-section for high angle scattering: • Cross-section for elastic scattering is a function of Z • As t increases, more elastic scattering because the mean elastic free • path is fixed
TEM variables that affect the contrast: -The objective aperture size (large -- bad). -The high tension of the TEM (small -- good)
TEM variables that affect the contrast: -The objective aperture size (large -- bad). -The high tension of the TEM (small -- good)
Objectiveaperturesizeeffectonmass-thicknesscontrast in TEM mode d=10 μm d=70 μm Similar effect as reducing the HT of the microscope
kV Calculate the mass thickness contrast: Atom. Nr. Characteristic screening angle (by the electron cloud) Collection semi-angle (angle of collection of the obj. app.) Derived from: To determine the probability that an e- will be scattered farther than a given angle.
Imaging electron scattering at: • Low angles (<~5o) : - Mass-thickness contrast + Bragg diffraction • 2. Higher angles: - Only mass-thickness contrast • (low intensity scattered beams) • - Intensity only depends on Z (and on thickness) Only mass-thickness contrast – How? A) Amorphous samples: All contrast is mass contrast B) Crystalline samples: ADF/HAADF mode
Imaging electron scattering at: • Low angles (<~5o) : - Mass-thickness contrast + Bragg diffraction • 2. Higher angles: - Only mass-thickness contrast • (low intensity scattered beams) • - Intensity only depends on Z (and on thickness) Only mass-thickness contrast: A) Amorphous samples: All contrast is mass contrast B) Crystalline samples: ADF/HAADF mode
STEM- ADF • 1. Less noisy than DF-TEM: Gathers all scattered electrons, not just electrons scattered from one atomic plane. • 2. The lenses are not used to make the ADF image – less chromatic aberration. • 3. More contrast than TEM-DF: Adjust L to optimize the ratio of the number of scattered e- hitting the detector. • 4. Lower resolution than TEM-DF (probe size + intensity) • 5. Alignment, alignment, alignment • When use STEM: • Thick specimen (aberrations) • Beam-sensitive specimens (…) • Specimen has low contrast in TEM • Z-contrast e- ( DF) e- ( BF)
DF: TEM - STEM STEM ADF contrast is greater than DF TEM Optimal L TEM-DF STEM-ADF The TEM image of the two phase polymer is noisier, but has better resolution.
HAADF At high angles (> 5o) Bragg scattering is negligible: Z-contrast images ↔ HAADF images. TEM Z-contrast (Bi in Si) HAADF has the advantage that the contrast is generally unaffected by small changes in objective lens defocus (Df) and specimen thickness.
Noise reduction of Z-contrast images HAADF images can be processed and refined via a maximum entropy approach to reduce noise. Direct map of f(θ) variation in the specimen (similar to an X-ray map). Grain boundary in SrTiO3
Example of HR Z-contrast with the HAADF detector Atomic structures are visible in both HREM and HAADF images. HAADF image: noisier but Z-contrast. Relate the intensity differences to an absolute measure of the Bi concentration: Cross-section for elastic scattered by matrix A Contrast Fraction of the alloying element that sub. For matrix atoms HREM-TEM HR Z-contrast STEM Atomic concentration of alloying element Alloying/dopant B
Exampleofmass-thicknesscontrast in TEM mode- Metalshadowing BF-TEM image of latex particles on an amorphous C-film. The contrast is t-dependent. What is the shape of the particles? Effect of evaporation of a heavy metal (Au or Au-Pd) thin coating at an oblique angle. What is the contrast due to in the image? Effect of inversing the contrast of the image. The uneven metal shadowing increases the mass contrast and thus accentuates the topography.
Enhancementofcontrast - Stainingof polymers and biologicalspecimens Heavy metal stains: Os, Pd and U The heavy metals are left in spesific regions of the structures: Unsaturated C=C bonds in polymers and cell walls in biological tissue. Stained two phase polymer (BF-TEM mode) (BF-STEM mode) Increased contrast, but lower image quality (unless FEG).
TEM diffraction contrast Bragg diffraction contrast: - Coherent elastic scattering (atoms do not scatter independently) - Crystal structure - Orientation of the sample
Two-beam condition S: small and positive The excess hkl Kikuchi line, just outside the hkl spot; 1. What is S? 2. And how to determine S ? Diff. rotation
Two-beam condition S: small and positive The excess (bright) hkl Kikuchi line, just outside the hkl spot; S is..?
Variation in the diffraction contrast when s is varied from zero small + larger + TEM always shows better contrast than STEM images
Examples • Two types of steel (Martensite + Austenite)
Examples • Two types of steel (Martensite + Austenite)
Examples • Two types of steel (Martensite + Austenite) • Erbium-oxide nanoclusters in silicon oxide
Examples • Two types of steel (Martensite + Austenite) • Erbium-oxide nanoclusters in silicon oxide
Summary Mass-thickness contrast -Areas of greater Z and or t scatter more strongly -TEM images are better quality (lower noise and higher resolution) than STEM images, but digital STEM images can be processed to show higher contrast than analog TEM images. • STEM mass-thickness contrast images are most useful for thick and/or beam-sensitive specimens. • Z-contrast (HAADF) images can show atomic-level resolution. Diffraction contrast -Arises when the electrons are Bragg scattered. -In TEM, the objective aperture selects one Bragg scattered beam. -Often, the STEM detectors gather several Bragg beams which reduce diffraction contrast. -TEM always shows better contrast than STEM images (noisier and almost never used)
Objective aperture BF image DF image HREM image Size of objective apertureBright Field (BF), Dark Field (DF) and High Resolution EM (HREM) Phase contrast Amplitude/Diffraction contrast
Phase Contrast Imaging Exploits differences in the refractive index of different materials to differentiate between structures under analysis
Why different phases? • Transmitted and diffracted waves travel through different distances in the crystal • Each diffracted wave will have its own phase • Each diffracted wave represents a different solution to the Schrödinger equation When several waves are allowed to interact, the phase differences manifest themselves in the 2-D interference pattern in the image plane --- Phase contrast image Factors that contribute to the phase shift: Thickness, orientation, scattering factor, focus and astigmatism. Be careful when interpreting them
The origin of the lattice fringes (2-D interference pattern) Rewrite the wave equation for two beams: KD = K + KI K is the difference vector : K = KD – KI K = Sg + g