Download
1 / 31
340 likes | 593 Views
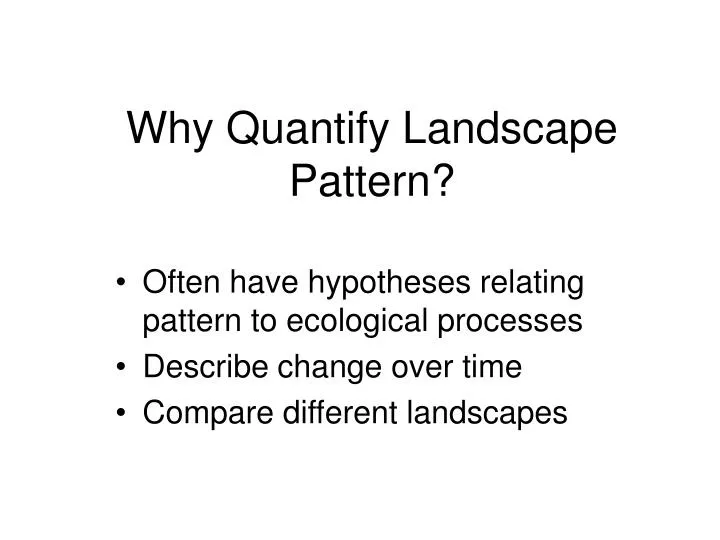
Why Quantify Landscape Pattern?. Often have hypotheses relating pattern to ecological processes Describe change over time Compare different landscapes.

E N D
Why Quantify Landscape Pattern? Often have hypotheses relating pattern to ecological processes Describe change over time Compare different landscapes
Changes in forest cover (shaded green) since the time of European settlement for Cadiz Township in southeastern Wisconsin. This pattern can be observed in many areas and illustrates both the changes in the abundance and spatial arrangement of forest in the landscape. From Turner, Gardner, and O’Neill 2002
Changes in conifer (green) and other forest types for a private and public landscape (2,500 ha) with similar initial conditions and rates of change that are relatively high for the ownership types. Landscape metrics were used to quantify the differences in landscape pattern between ownerships. From Turner, Gardner, and O’Neill 2002
What is landscape pattern? • Number of types • Proportion of each type on the landscape • Spatial arrangement of patches • Patch shape • Contrast between neighboring patches
Two principal methods for representing spatial data in a GIS: vector-based representation and raster, or cell-based, representation. From Turner, Gardner, and O’Neill 2002
Basic components of metrics • Fraction or proportion (p) of landscape occupied • Number of land cover classes present • Probabilities of adjacency among classes • Contagion or ‘clumpiness’ within a class
Basic components of metrics—patch based • Patch area or size • Patch perimeter • Connectivity/fragmentation within a cover type class (e.g., mean interpatch distance) • Patch shape and edge characteristics
Examples of how the same landscape looks very different under different classification schemes. Both panels show how a 5- by 5-km section (100 grid cells) of southwestern Yellowstone National Park. (a) The landscape is classified based on forest community composition. (b) The landscape is classified based on successional stage of the forest stands. From Turner, Gardner, and O’Neill 2002
Effects of changing extent on a landscape of southwestern Yellowstone National Park. Note that the presence and relative proportions of the different land-cover types change as the extent of the map varies. From Turner, Gardner, and O’Neill 2002
Definition of what constitutes a ‘patch’ matters Identification of patches (shaded) on the same map using either (a) a four-neighbor rule, in which the horizontal and vertical neighbors are considered, but the diagonal neighbors are not, and (b) an eight-neighbor rule, in which the horizontal, vertical, and diagonal neighbors are all considered. From Turner, Gardner, and O’Neill 2002
One index is not sufficient--but how many? Three-dimensional pattern space in which three subregions of the southeastern United States are characterized by three landscape metrics. From Turner, Gardner, and O’Neill 2002
A useful set of metrics-- • Are selected for a particular objective • Measured values are well-distributed over range • Metrics are relatively independent
Research still needed— • Relation of metrics/pattern to process • Sensitivity of similar metrics for detecting change • Statistical and sampling properties of metrics
Garden City, KansasImage taken 9/25/2000 Center pivot irrigation systems create red circles of healthy vegetation in this image of croplands near Garden City, Kansas. Garden City can be found on Landsat 7 WRS Path 30 Row 34, center: 37.48, -100.51. US Geological Survey/NASA http://astroboy.gsfc.nasa.gov/earthasart/index.html US Geological Survey/NASA http://astroboy.gsfc.nasa.gov/earthasart/index.html
Florida EvergladesImage taken 2/5/2000 Spanning the southern tip of the Florida Peninsula and most of Florida Bay, Everglades National Park is the only subtropical preserve in North America. It contains both temperate and tropical plant communities, including sawgrass prairie, mangrove and cypress swamps, pinelands, and hardwood hammocks, as well as marine and estuarine environments. The park is known for its rich bird life, particularly large wading birds, such as the roseate spoonbill, wood stork, great blue heron, and a variety of egrets. It is also the only place in the world where alligators and crocodiles exist side by side. The Everglades can be found on Landsat 7 WRS Path 15 Row 42, center: 26.00, -80.43. US Geological Survey/NASA http://astroboy.gsfc.nasa.gov/earthasart/index.html