Download
1 / 16
160 likes | 415 Views
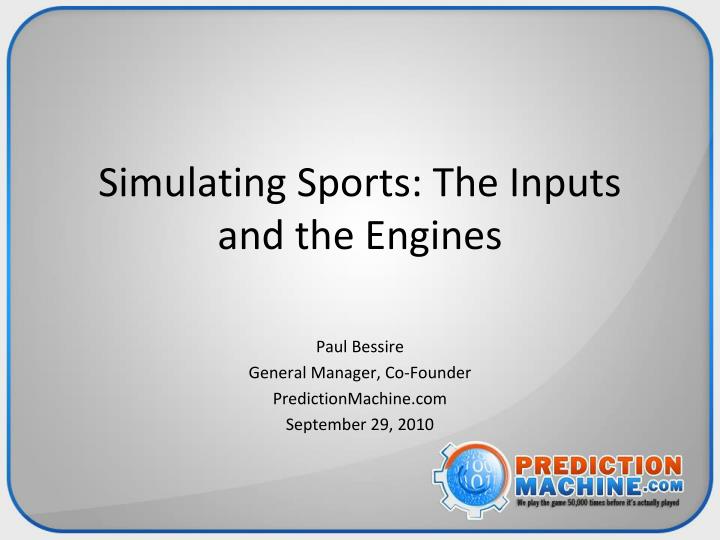
Simulating Sports: The Inputs and the Engines. Paul Bessire General Manager, Co-Founder PredictionMachine.com September 29, 2010. Table of Contents. Intro PredictionMachine.com & Simulation Overview Simulating Baseball Plate Appearance Decision Tree Examples (more second presentation).

E N D
Simulating Sports: The Inputs and the Engines Paul Bessire General Manager, Co-Founder PredictionMachine.com September 29, 2010
Table of Contents • Intro • PredictionMachine.com & Simulation Overview • Simulating Baseball • Plate Appearance Decision Tree • Examples (more second presentation)
Introduction • 2004 University of Cincinnati BBA, Finance and QA • 2005 MSQA - Master’s Project (with Dr. Fry): Measuring Individual and Team Effectiveness in the NBA Through Multivariate Regression • 2004 – 2009 WhatIfSports.com/FOXSports.com, Director, Content and Quantitative Analysis • 2010 Launched PredictionMachine.com in February
About PredictionMachine.com • “We play the game 50,000 times before it’s actually played.” • Built by Paul Bessire to focus on content after six years at WhatIfSports.com/FOXSports • February 2010 - Launched with Super Bowl Prediction (Indianapolis 28 – New Orleans 27) • “Predictalator” – Simulation engine plays entire NFL season 50,000 times in 8 seconds • March Madness, NBA Playoffs, MLB Daily, College Football, NFL • Customizable Predictalator – Any teams, Any where, Any line • Fantasy Football Projections • Live simulator built to analyze in-game winning probabilities and value in coaching decisions
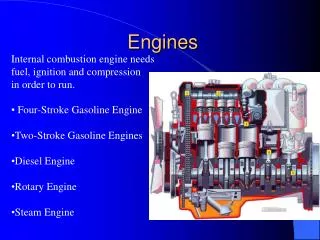
Sports Simulation • Play-by-play • A “play” means something different for each sport • Probabilities for every individual outcome • Random number generation • Pitch-by-pitch (or basketball/hockey pass-by-pass) not needed • Account for every possible statistical interaction during a game • Can be recreated quickly • 50,000+ games/second • All data tracked • Every outcome is different • Boxscores
Pitchers HBP/BF BB/(BF – HBP) OAV 1B/Hit Allowed 2B/Hit Allowed 3B/Hit Allowed HR/Hit Allowed K/Out GO/FO BF Pitches Thrown/BF Relative Range Factor Fielding Percentage Handedness Ballpark Effects League Averages Hitters HBP/PA BB/(PA – HBP) AVG 1B/Hit 2B/Hit 3B/Hit HR/Hit K/Out GO/FO PA Relative Range Factor Fielding Percentage Catcher Arm Rating CS% (Runner) Speed Rating Handedness Ballpark Effects League Averages Significant Stats
Pitchers Wins Losses Saves Holds Complete Games Shutouts ERA (kind of – 2B and 3B approx) Unearned Runs Games Started Pitch Types Performance in Counts Other Situational Stats Hitters RBI IBB Runs (kind of – in Speed Formula) GIDP (kind of – in Speed Formula) SF (kind of – in PA, but also situational) SH (kind of – in PA, in but also situational) SBA (kind of – attempts, but also setting) Performance in Counts Other Situational Stats Insignificant Stats
PA Decision Tree - Normalization Every step in PA uses modified* log5 normalization (Bill James AVG example): H/AB = ((AVG * OAV) / LgAVG) / ((AVG * OAV) / LgAVG + (1- AVG )*(1- OAV)/(1-LgAvg)) Where, LgAVG = (PLgAVG + BLgAVG)/2 2000 Pedro vs. 1923 Ruth Example: H/AB = ((.393 * .167) / .2791) / ((.393 * .167) / .2791+ (1- .393)*(1- .167)/(1-.2791)) Where, LgAVG = (.283 + .276)/2 or .2791 Result = .2504 * Modified due to a flaw in the assumption above that the batter and pitcher carry equal (50/50) weights on each possible outcome of the PA event. Also accounts for handedness and ballpark.
Plate Appearance Unusual Event (IBB, WP, PB, SB, CS, SH, Hit and Run, Pickoff, Balk) Normal PA HBP (per PA or BFP) Not HBP BB (per PA or BFP – HBP) At Bat… PA Decision Tree – Steps 1* * No ballpark or handedness adjustments made yet.
PA Decision Tree – Steps 2 * Historical handedness adjustment and ballpark hits multiplier used.
Hit* Normal – In Play HR* (HR/Hit) Out (Plus Play) Normal Hit 3B* (3B/Hit * multiplier for lost HR) 2B* (2B/Hit * multiplier for lost HR) 1B PA Decision Tree – Steps 3 * Ballpark multipliers used.
PA Decision Tree – Matchup Weights Addresses previous 50/50 assumption using League-Adjusted Variance to form batter and pitcher weights for each step:
Matchup Weights: What does this mean? • Batter always has more control (even with HBP and BB) • Makes final decision (Swing or not) • Dictates strike zone • Less consistent • Doubles and Triples are (mostly) out of pitcher’s control (BABIP) • Does not necessarily batting is more important • 9 vs. 1 • Fewer pitcher outliers means elite pitchers are more valuable
PA Decision Tree - Normalization Batting Average Example using Matchup Weights: H/AB = ((1.066*AVG * .934*OAV) / LgAVG) / ((1.066*AVG * .934*OAV) / LgAVG + (1.066- 1.066*AVG )*(.934- .934*OAV)/(1-LgAvg)) Where, LgAVG = (.934*PLgAVG + 1.066*BLgAVG)/2 2000 Pedro vs. 1923 Ruth Example (with handedness): H/AB = ((1.066*.393 * .167 * .934) / .2795) / ((.393 * .167) / .2795+ (1- .393)*(1- .167)/(1-.2795)) Where, LgAVG = (1.066*.283 + 0.934*.276)/2 or .2795 Result * Handedness = .2502 * 1.045 Final Result = .2614