Download
1 / 13
130 likes | 709 Views
2. Metrics/Measurement and Balanced Scorecard - Background. Financial Management (FM) metrics program began in Aug 01 with four metrics on problem disbursementsAt present, the financial management metrics are mainly being monitored at a Department levelData is provided to OUSD(C) by DFAS and uploaded onto their Financial Indicator websiteSince Aug 01, DoD has grown into a Balanced Scorecard management approach footprint with over 25 key indicators covering accounting and finance, business man30476

E N D
1. 1
2. 2 Metrics/Measurement and Balanced Scorecard - Background Financial Management (FM) metrics program began in Aug 01 with four metrics on problem disbursements
At present, the financial management metrics are mainly being monitored at a Department level
Data is provided to OUSD(C) by DFAS and uploaded onto their Financial Indicator website
Since Aug 01, DoD has grown into a Balanced Scorecard management approach footprint with over 25 key indicators covering accounting and finance, business management, and budget and OUSD(C) is leading DoD into implementation of an Automated Balanced Scorecard
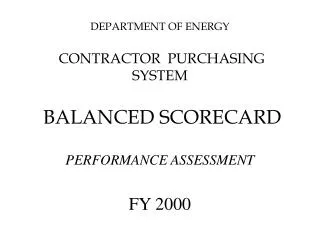
OUSD(C) memo of 26 Feb 04 announced the DoD FM Balanced Scorecard that aligns strategy, goals, objectives and related performance metrics with the risk management framework established in the Quadrennial Defense Review and Management Initiative Decision 901
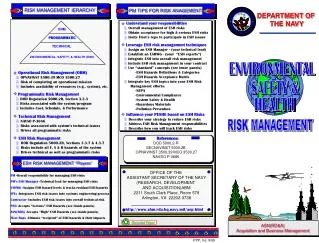
3. 3 Metrics/Measurement and Balanced Scorecard The risk framework is made of four areas:
Force Management Risk
Operational Risk
Future Challenges Risk
Institutional Risk
Based on this framework, DoD developed their scorecard within the same structure:
Force Management Risk (Innovation & Learning Perspective)
Operational Risk (Financial Perspective)
Future Challenges Risk (Internal Business Perspective)
Institutional Risk (Customer Perspective)
4. 4 Metrics/Measurement and Balanced Scorecard This graphic shows the four risk areas that affect financial management: Force Management Risk, Operational Risk, Future Challenges Risk, and Institutional Risk.This graphic shows the four risk areas that affect financial management: Force Management Risk, Operational Risk, Future Challenges Risk, and Institutional Risk.
5. 5 Metrics/Measurement and Balanced Scorecard The slide shows a four panel table with the following headings: Combat Capability, People, Technology Insertion, and Improved Business Practices.The slide shows a four panel table with the following headings: Combat Capability, People, Technology Insertion, and Improved Business Practices.
6. 6 This graphic shows how the DoD Financial Management Scorecard related to the DFAS Balanced Scorecard Metrics. An arrow connects the DoD Financial Management Scorecard attributes Institutional Risk to DFAS Balanced Scorecard Metrics Customer, Operational Risk to Financial, Future Challenges Risk to Internal, and Force Management Risk with Growth and Learning.This graphic shows how the DoD Financial Management Scorecard related to the DFAS Balanced Scorecard Metrics. An arrow connects the DoD Financial Management Scorecard attributes Institutional Risk to DFAS Balanced Scorecard Metrics Customer, Operational Risk to Financial, Future Challenges Risk to Internal, and Force Management Risk with Growth and Learning.
7. 7 Link BSC to Agency�s Vision and Goals This graphic relates the Balanced Scorecard to the DoD vision and goals. The graphic shows Vision in the left column, connecting to Goals in the next column, connecting to Objectives in the next column, to Measures in the right side column.This graphic relates the Balanced Scorecard to the DoD vision and goals. The graphic shows Vision in the left column, connecting to Goals in the next column, connecting to Objectives in the next column, to Measures in the right side column.
8. 8 Cause and Effect Relationship of Objectives This chart shows the cause and effect relationship between the objectives described on the previous chart and the ultimate end result of delivering value to the taxpayer. The chart from the bottom section titled Growth and Learning leads up to the next level titled Internal, which leads up to the next level titled Financial, which leads to the next level titled Customer, which leads to the top titled Best Value.This chart shows the cause and effect relationship between the objectives described on the previous chart and the ultimate end result of delivering value to the taxpayer. The chart from the bottom section titled Growth and Learning leads up to the next level titled Internal, which leads up to the next level titled Financial, which leads to the next level titled Customer, which leads to the top titled Best Value.
9. 9 Metrics/Measurement and Balanced Scorecard In November 2004, OUSD(C) formed a Working Group consisting of all the services and many DoD agencies to begin the development of the Financial Management Automated Balanced Scorecard (FABS)
Automating the scorecard will provide
A web-based tool to facilitate feedback, communication, and management decision-making
Capability to integrate with accounting system data and receive multiple source data formats
More timely, accurate, and consistent data
More time to do better analysis
Enhanced acceptance of the program
More sophisticated, more timely and accurate reporting
10. 10 Metrics/Measurement and Balanced Scorecard FABS Implementation Schedule:
Implemented in Three of More Phases:
Phase I � Pilot/Test (DFAS, BMSI, & PME)
(NLT June 2005)
Phase II � Developed to all DoD Reporting Entities
(NLT September 2005)
Phase IIIa � Possible System Integration (TBD)
Phase IIIb � Additional Modules Added (TBD)
11. 11 Metrics/Measurement and Balanced Scorecard Why do you care about the DoD FM Automated Balanced Scorecard and DoD Financial Management Metrics?
Using the established DoD Financial Indicators as a baseline, FMO is reviewing those metrics that data can be captured down to the Major Command level
While the framework of the ABS is developing, FMO Team Leads with cognizance over that metric, will begin using/developing key metrics to be used as �Report Cards or �Scorecards� by Major Command
These Scorecards will enable us to identify those specific areas and Major Commands where concentration may be needed to accomplish the efforts of the Financial Improvement Plan or DoD/DON wide efforts
12. 12 Metrics/Measurement and Balanced Scorecard Financial Indicator metrics identified as potential Scorecards
Interest Penalties Paid
Accounts Receivable
Problem Disbursements (UMD/NULO)
Travel Card Delinquencies
Purchase Card Delinquencies
In addition to the main DoD Financial Indicator metrics, each Team will be developing other internal DON metrics to assist us in tracking our progress towards a Clean Audit Opinion and Department wide process improvements
To become more familiar with the DoD Comptroller Financial Indicators Program and the level of metrics presently being produced, visit their website at https://dod-metrics.dfas.mil. Access to this site requires a Common Access Card or soft certificate.
13. 13 Metrics/Measurement and Balanced Scorecard This chart is a representation of the balanced scorecard with sample Commands inserted. The sample has the Metrics listed in the left column, with commands listed horizontally and Goals listed in the right column. The intersections have color coded scorecard results of red, green, or yellow.This chart is a representation of the balanced scorecard with sample Commands inserted. The sample has the Metrics listed in the left column, with commands listed horizontally and Goals listed in the right column. The intersections have color coded scorecard results of red, green, or yellow.
14. 14 Metrics/Measurement and Balanced Scorecard ASN(FM&C) Metric Points of Contact:
Nancy Carpenter
Nancy.carpenter@navy.mil
(202) 685-6725, DSN 325
Warren Pfeiffer
Warren.pfeiffer@navy.mil
(202) 685-6730, DSN 325