Download
1 / 20
200 likes | 545 Views
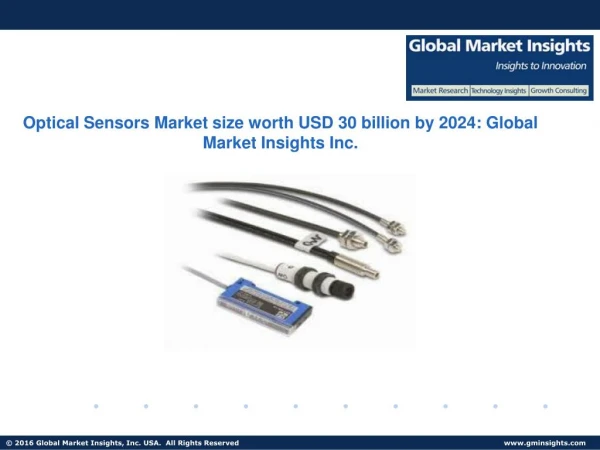
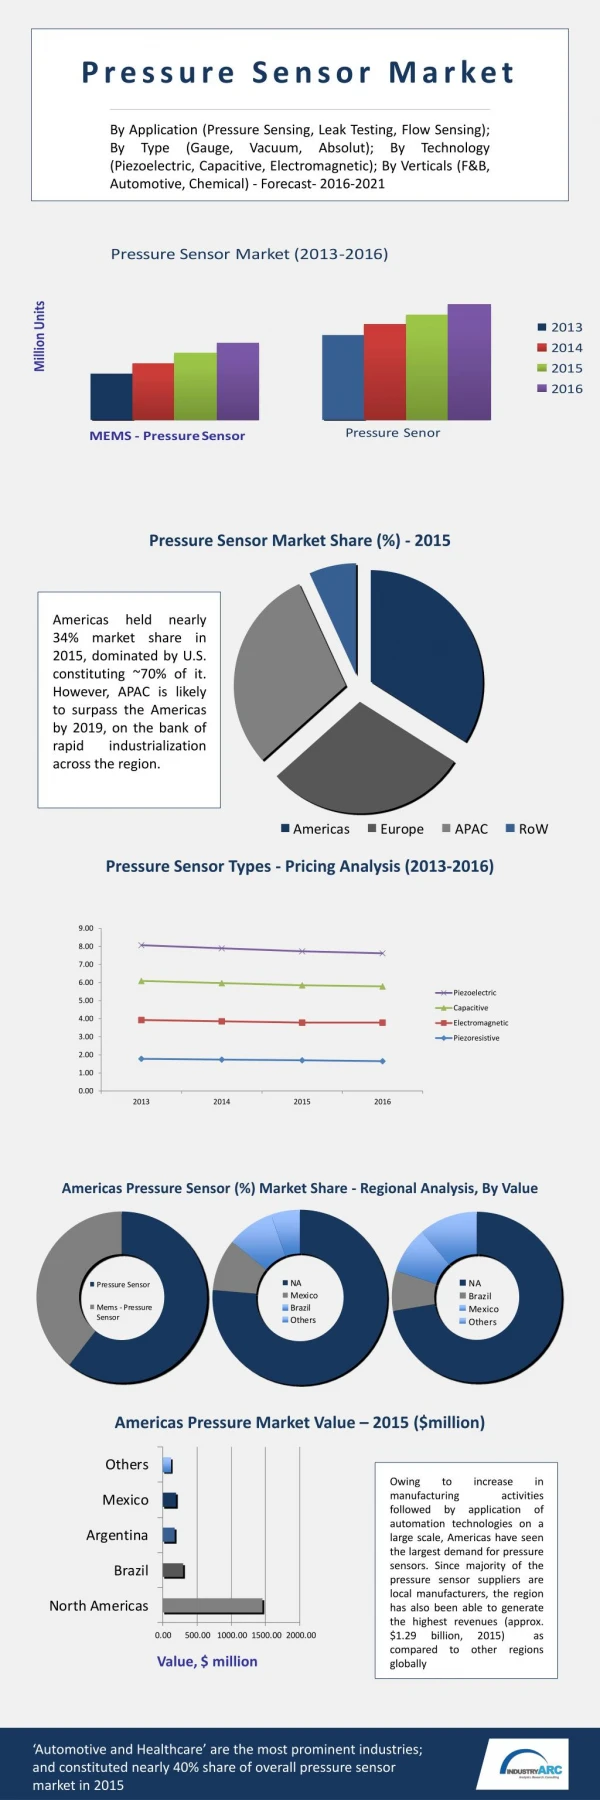
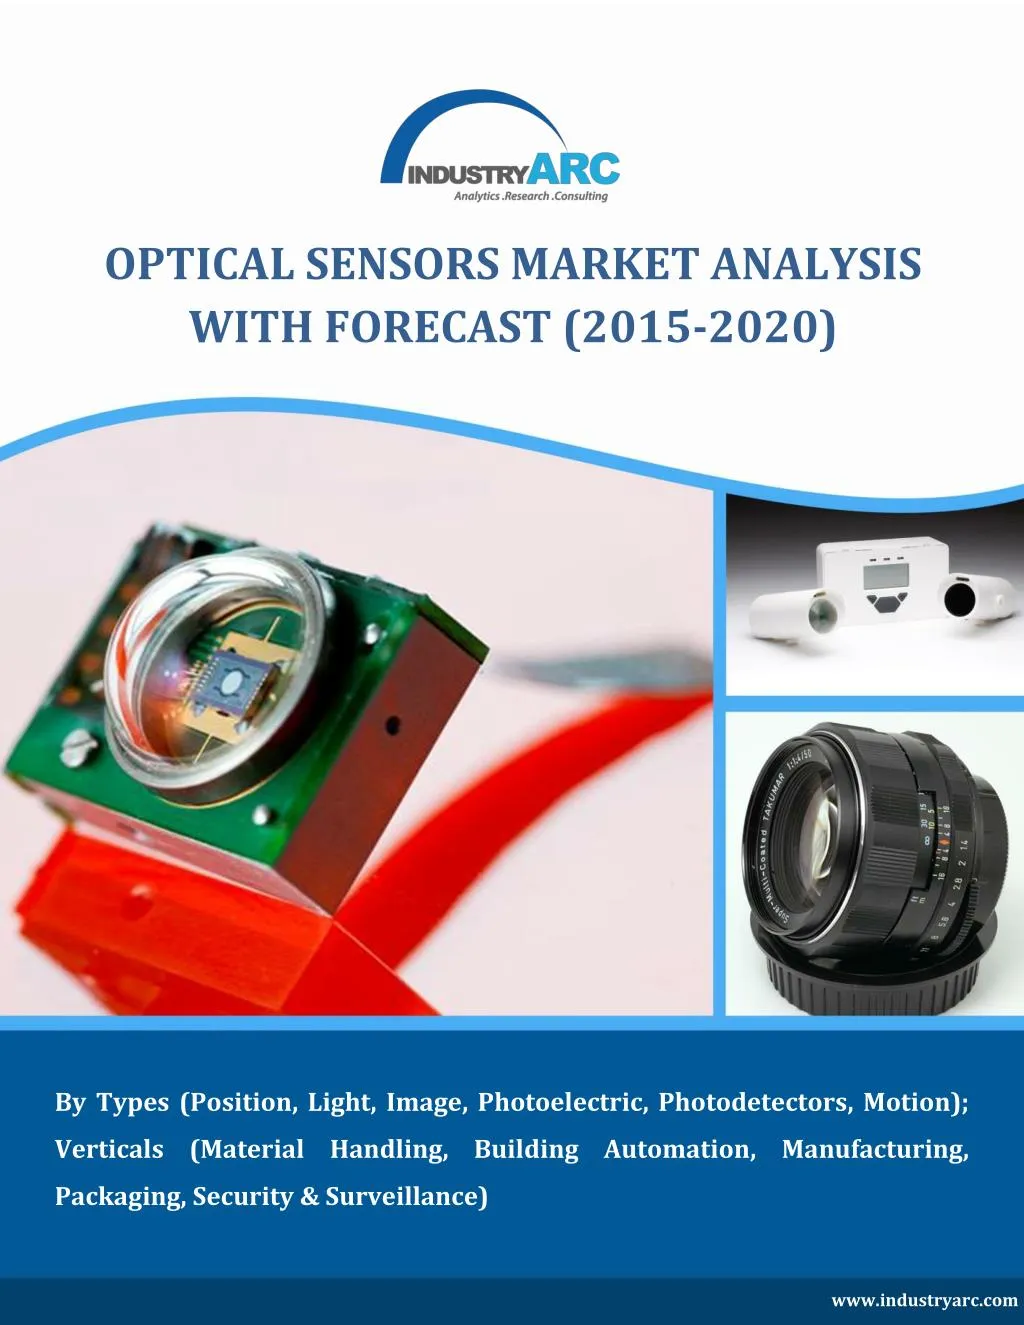
The Report “Optical Sensors Market Analysis: By Types (Position, Light, Image, Photoelectric, Photodetectors, Motion); Verticals (Material Handling, Building Automation, Manufacturing, Packaging, Security & Surveillance) - With Forecast (2015-2020)”, according to a recent study from IndustryARC, the market to reach $34 billion by 2020<br><br>To Browse 64 Market Tables, 48 Figures spread through 170 Pages and an in-depth TOC on “Optical Sensors Market” Download Free Sample Brochure @ <br>http://industryarc.com/pdfdownload.aspx?id=58<br>

E N D
OPTICAL SENSORS MARKET ANALYSIS WITH FORECAST (2015-2020) By Types (Position, Light, Image, Photoelectric, Photodetectors, Motion); Verticals (Material Handling, Building Automation, Manufacturing, Packaging, Security & Surveillance) www.industryarc.com
To Enquire About the Report Click Here TABLE OF CONTENTS 1Optical Sensors – Market Overview 1.1Scope 1.2Stakeholders 2Executive Summary 2.1Key Market Insights 3Optical Sensors – Market Landscape 4Optical Sensors – Market Forces 4.1Market Drivers 4.1.1Demand From Automation Industry Driving Growth of Optical Sensors 4.1.2Increasing Demand For Color Detection Sensors In The Industry Automation Vertical 4.1.3Rising Penetration of Smartphones In Global Market 4.1.4Lewis Turning Point In China 4.1.5Internet of Things 4.1.6Rise of Industrial Automation 4.2Market Constraints 4.2.1Product Substitution 4.2.2Irregularities In Investment Cycles 4.3Market Challenges 4.3.1Offshore Manufacturing Facilities 4.3.2Operational Limitations 4.4Attractiveness of The Optical Sensors Industry 4.4.1Power of Suppliers 4.4.2Power of Customers 4.4.3Threat of New Entrants 4.4.4Threat of Substitution 4.4.5Degree of Competition 5Optical Sensors – Strategic Analysis
To Enquire About the Report Click Here 5.1Value Chain Analysis 5.2Pricing Analysis 5.3Opportunities Analysis 5.4Product Life Cycle Analysis 6Optical Sensors Market – Product Types Analysis 6.1Position Sensors 6.1.1Position Sensors – End Use Verticals Analysis 6.1.2Position Sensors Market – Geographic Analysis 6.1.2.1Americas 6.1.2.2Europe 6.1.2.3APAC 6.2Light Sensors 6.2.1Light Sensors Market – Product Types Analysis 6.2.2Light Sensors Market – End Use Verticals Analysis 6.2.3Light Sensors Market – Geographic Analysis 6.2.3.1Americas 6.2.3.2Europe 6.2.3.3APAC 6.3Image Sensors Global Market Analysis 6.3.1Image Sensors Market – Product Types Analysis 6.3.2Image Sensors Market – End Use Verticals Analysis 6.3.3Image Sensors Market – Geographic Analysis 6.3.3.1Americas 6.3.3.2Europe 6.3.3.3APAC 6.4Photoelectric Sensors 6.4.1Photoelectric Sensors Market – Product Types Analysis 6.4.2Photoelectric Sensors Market – End Use Verticals Analysis 6.4.3Photoelectric Sensors Market – Geographic Analysis
To Enquire About the Report Click Here 6.4.3.1Americas 6.4.3.2Europe 6.4.3.3APAC 6.5Photodetectors 6.5.1Photodetector Market – Product Types Analysis 6.5.2Photodetector Market – End Use Verticals Analysis 6.5.3Photodetector Market – Geographic Analysis 6.5.3.1Americas 6.5.3.2Europe 6.5.3.3APAC 6.6Safety Sensor 6.6.1Safety Sensor Global Market-by End Users Verticals 6.6.2Safety Sensor Global Market- by Geography 6.6.2.1Americas 6.6.2.2Europe 6.6.2.3APAC 6.7Motion Sensors 6.7.1Motion Sensors Market – Product Types Analysis 6.7.2Motion Sensors Market – End Use Verticals Analysis 6.7.3Motion Sensors Market – Geographic Analysis 6.7.3.1Americas 6.7.3.2Europe 6.7.3.3APAC 6.8Ir Detectors 6.8.1Ir Detectors Market – Product Types Analysis 6.8.2Ir Detectors Market – End Use Verticals Analysis 6.8.3Ir Detectors Market – Geographic Analysis 6.8.3.1Americas 6.8.3.2Europe
To Enquire About the Report Click Here 6.8.3.3APAC 7Optical Sensors Market – End Use Verticals Analysis 7.1Aerospace And Defense 7.2Automotive 7.3Building Automation 7.4Chemical 7.5Consumer Electronics 7.6Food & Beverage 7.7Manufacturing 7.8Material Handling 7.9Medical & Scientific Devices 7.10Office Equipment 7.11Packaging 7.12Paper & Print 7.13Security & Surveillance 7.14Wireless Communications 8Optical Sensors Market – Geographic Analysis 8.1Introduction 8.2Americas 8.2.1North America 8.2.2Mexico 8.2.3Argentina 8.2.4Brazil 8.2.5Others 8.3Europe 8.3.1Germany 8.3.2UK 8.3.3France 8.3.4Others
To Enquire About the Report Click Here 8.4APAC 8.4.1China 8.4.2Japan 8.4.3South Korea 8.4.4Others 8.4.5Row 9Market Entropy 9.1New Product Launches 9.2M&As, Collaborations, JVs And Partnerships 10Company Reports 10.1Hamamatsu Photonics K.K. 10.1.1Business Overview 10.1.2Products 10.1.3Financials 10.1.4Developments 10.2Kistler Instrumente Ag 10.2.1Business Overview 10.2.2Products 10.2.3Financials 10.2.4Developments 10.3Leuze Electronic Gmbh + Co. Kg 10.3.1Business Overview 10.3.2Products 10.3.3Financials 10.3.4Developments 10.4Baumer Electric Ag 10.4.1Business Overview 10.4.2Products 10.4.3Financials
To Enquire About the Report Click Here 10.4.4Developments 10.5Ifm Electronic Gmbh 10.5.1Business Overview 10.5.2Products 10.5.3Financials 10.5.4Developments 10.6Sofradir Ec, Inc 10.6.1Business Overview 10.6.2Products 10.6.3Developments 10.7Vigo System S.A. 10.7.1Business Overview 10.7.2Products 10.7.3Developments 10.8Carlo Gavazzi Automation Spa 10.8.1Business Overview 10.8.2Products 10.8.3Financials 10.8.4Developments 10.9Theben AG 10.9.1Business Overview 10.9.2Products 10.9.3Financials 10.9.4Development 10.10Teledyne Dalsa 10.10.1Business Overview 10.10.2Products 10.10.3Financials 10.10.4Development
To Enquire About the Report Click Here 10.11Aptina Imaging 10.11.1Business Overview 10.11.2Products 10.11.3Financials 10.11.4Developments 10.12Pepperl + Fuchs Gmbh 10.12.1Business Overview:- 10.12.2Products: 10.12.3Financials- 10.12.4Developments 10.13ST Microelectronics 10.13.1Business Overview 10.13.2Products 10.13.3Financials 10.13.4Developments- 10.14Rohm Semiconductor 10.14.1Business Overview 10.14.2Products 10.14.3Financials 10.15Omnivision Technologies 10.15.1Business Overview 10.15.2Products 10.15.3Financials 10.15.4Developments 10.16Vishay Intertechnology, Inc. 10.16.1Business Overview 10.16.2Products 10.16.3Financials 10.16.4Developments
To Enquire About the Report Click Here 10.17Panasonic Corporation 10.17.1Business Overview 10.17.2Products 10.17.3Financials 10.17.4Developments 10.18Steinel Professional 10.18.1Business Overview 10.18.2Products 10.19B.E.G Bruck Electronics Gmbh 10.19.1Business Overview 10.19.2Products 10.19.3Financials 10.19.4Developments 10.20Busch-Jaeger 10.20.1Business Overview 10.20.2Products 10.20.3Financials 10.20.4Developments 10.21Fairchild Semiconductor 10.21.1Business Overview 10.21.2Products 10.21.3Financials 10.21.4Developments 10.22First Sensor Ag 10.22.1Business Overview 10.22.2Products 10.22.3Financials 10.22.4Developments 10.23Optek Technology
To Enquire About the Report Click Here 10.23.1Business Overview 10.23.2Products 10.23.3Financials 10.24Irisys (Infrared Integrated Systems Limited) 10.24.1Business Overview 10.24.2Products 10.24.3Financials 10.24.4Developments 10.25Keyence Corporation 10.25.1Business Overview 10.25.2Products 10.25.3Financials 11Appendix 11.1Abbreviations 11.2Research Methodology And Sources 11.3Compilation of Expert Insights 11.4Disclaimer
To Enquire About the Report Click Here LIST OF TABLES Table 1 Table 2 Table 3 Table 4 Table 5 Table 6 Table 7 Table 8 Table 9 Table 10 Table 11 Table 12 Table 13 Table 14 Table 15 Table 16 Table 17 Table 18 Table 19 Table 20 Table 21 Table 22 Table 23 Table 24 Table 25 Table 26 Table 27 Table 28 Table 29 Table 30 Global Optical Sensors Market Forecast - by Type, 2015-2020 ($M) Image Sensors Market Share Analysis, 2014 (%) Position Sensors Market Share Analysis, 2014 (%) Light Sensors Market Share Analysis, 2014 (%) Photoelectric Sensor Market Share Analysis, 2014 (%) Motion/Presence Sensor Market Share Analysis, 2014 (%) IR Detectors Market Share Analysis, 2014 (%) Photodetectors Market Share Analysis, 2014 (%) Safety Sensors Market Share Analysis, 2014 (%) Global Optical Sensors Market, by Product Types, 2014 – 2020 ($M) Position Sensors Market, 2014 – 2020 ($M) Position Sensors Market, by End Use Verticals, 2014 – 2020 ($M) Americas Position Sensors Market, 2014 – 2020 ($M) Europe Position Sensors Market, 2014 – 2020 ($M) APAC Position Sensors Market, 2014 – 2020 ($M) Global Light Sensors Market, 2014 – 2020 ($M) Global Light Sensors Market, by Types, 2014 - 2020 ($M) Global Light Sensors Market, by End Use Verticals, 2014 – 2020 ($M) Global Light Sensors Market, by Geographic Region, 2014 – 2020 ($M) Americas Light Sensors Market, 2014 – 2020 ($M) Europe Light Sensors Market, 2014 – 2020 ($M) APAC Light Sensors Market, 2014 – 2020 ($M) Global Image Sensors Market, 2014 – 2020 ($M) Global Image Sensors Market, by Types, 2014 - 2020 ($M) Global Image Sensors Market, by End Use Verticals, 2014 – 2020 ($M) Americas Image Sensors Market, 2014 – 2020 ($M) Europe Image Sensors Market, 2014 – 2020 ($M) APAC Image Sensors Market, 2014 – 2020 ($M) Global Photoelectric Sensors Market, 2014 – 2020 ($M) Global Photoelectric Sensors Market, by Types, 2014 – 2020 ($M)
To Enquire About the Report Click Here Table 31 Global Photoelectric Sensors Market, by End Use Verticals, 2014 – 2020 ($M) Table 32 Table 33 Table 34 Table 35 Table 36 Table 37 Table 38 Table 39 Table 40 Table 41 Table 42 Table 43 Global Photoelectric Sensors Market, by Geographic Region, 2014 - 2020 ($M) Americas Photoelectric Sensors Market, 2014 – 2020 ($M) Europe Photoelectric Sensors Market, 2014 – 2020 ($M) APAC Photoelectric Sensors Market, 2014 – 2020 ($M) Global Photodetector Market, 2014 – 2020 ($M) Global Photodetector Market, by Types, 2014 - 2020 ($M) Global Photodetector Market, by End Use Verticals, 2014 – 2020 ($M) Global Photodetector Market, by Geographic Region, 2014 - 2020 ($M) Americas Photodetector Market, 2014 – 2020 ($M) Europe Photodetector Market, 2014 – 2020 ($M) APAC Photodetector Market, 2014 – 2020 ($M) Safety Sensors Market Revenue Share by End Users Verticals In $ Million (2015- 2020) Table 44 Table 45 Table 46 Table 47 Table 48 Table 49 Global Safety Sensor Market-by End Users Verticals In $ Million (2015-2020) Americas Safety Sensors Market, 2014 – 2020 ($M) Europe Safety Sensors Market, 2014 – 2020 ($M) APAC Safety Sensors Market, 2014 – 2020 ($M) Global Motion Sensor Market Revenue Share by Type In $ Million (2015-2020) Global Motion Sensors Market Revenue by End User Vertical In $ Million (2015- 2020) Table 50 Global Motion Sensors Market Revenue by Geographic Region In $ Million (2015- 2020) Table 51 Table 52 Table 53 Table 54 Table 55 Table 56 Table 57 Table 58 Americas’ Motion Sensors Market Revenue by Region In $ Million (2015-2020) Europe Motion Sensors Market Revenue by Region In $ Million (2015-2020) APAC Motion Sensors Market Revenue by Region In $ Million (2015-2020) Global IR Detectors Market Revenue by Type In $ Million (2015-2020) Global IR Detectors Market Revenue by Applications In $ Million (2015-2020) Global IR Detectors Market Revenue by Geography In $ Million (2015-2020) Americas IR Detectors Market Revenue by Region In $ Million (2015-2020) Europe IR Detectors Market Revenue by Region In $ Million (2015-2020)
To Enquire About the Report Click Here Table 59 APAC IR Detectors Market Revenue by Region In $Million (2015- 2020) Table 60 Table 61 Table 62 Table 63 Table 64 Global Optical Sensors Market by Geography (2015-2020) Americas Optical Sensors Market, 2015-2020 (In $M) Europe Optical Sensors Market, 2015-2020 (In $M) APAC Optical Sensors Market, 2015-2020 (In $M) Rest of World, Optical Sensors Market, 2014 – 2020 ($M)
To Enquire About the Report Click Here LIST OF FIGURES Figure1 Global Process Automation And Instrumentation Market Revenue, 2012 - 2020 ($Bn) Figure2 Figure3 Figure4 Figure5 Figure6 Figure7 Figure8 Figure9 Smartphone Launch History Global Smartphone Sales, 2010-2016 (Million Units) Smartphone Hardware And Component Analysis Global Smartphone Unit Shipment Milestones, 2011 - 2020 Estimated Percentage Of Working Age Population-China, 1990 – 2020 (%) Progress Of Internet Of Things, 2000 – 2020 Global Optical Sensors Market, Value Chain Analysis Average Selling Price Analysis Of Optical Sensors Market - by Key Players – 2014 ($) Figure10Global Photoelectric Sensors Market-by Type Of Sensor, 2014 (%) Figure11Global Proximity Photoelectric Sensors Market-by End Use Verticals, 2014 (%) Figure12Photoelectric Sensors Market, by Geographic Regions, 2014 (%) Figure13Americas Photoelectric Sensor Market, by Country, 2014 (%) Figure14Europe Photoelectric Sensor Market, by Country, 2014 (%) Figure15APAC Photoelectric Sensor Market, by Country, 2014 (%) Figure16Safety Sensors Market Revenue Share by End Users Verticals (2014) (%) Figure17Global Safety Sensors Market Revenue Share by Geographic (2014) (%) Figure18Global Motion Sensors Market Revenue Share by End User Vertical (2014) (%) Figure19Global Motion Sensors Market Revenue Share by Geographic Region (2014) (%) Figure20Americas’ Motion Sensors Market Revenue Share by Region (2014) (%) Figure21Europe Motion Sensors Market Revenue Share by Region (2014) (%) Figure22APAC Motion Sensors Market Revenue Share by Region (2014) (%) Figure23Global IR Detectors Market Revenue Share by Applications (2014) (%) Figure24Global IR Detectors Market Revenue Share by Geography (2014) (%) Figure25Americas IR Detectors Market Revenue Share by Region (2014) (%)
To Enquire About the Report Click Here Figure26Europe IR Detectors Market Revenue Share by Region In $Million (2014) Figure27APAC IR Detectors Market Revenue Share by Region (2014) (%) Figure28Global Optical Sensors Market Share-by Region, 2014 (%) Figure29Estimated Shale Oil Production-Argentina Figure30Estimated Automobile Production-China (Million Unit Vehicles), 2014 - 2020 Figure31Estimated Smartphone Penetration Market-Japan (%), 2014 - 2020 Figure32Global Infrared Sensors Market – Product Launches (2012-2014) Figure33Global Infrared Sensors Market – Product Launches – by Key Players (2014- 14) Figure34Global Infrared Sensors Market – M&A's, Collaborations, JV's & Partnerships, by No. Of Developments (2012-14) Figure35Global Infrared Sensors Market – by M&A's, Collaborations, Jv's & Partnerships Figure36Hamamatsu Photonics Revenue by Segment (% Share), 2014 Figure37Hamamatsu Photonics Revenue by Geography (% Share), 2014 Figure38Carlo Gavazzi Automation Spa Revenue by Region (% Share), 2014 Figure39ST Microelectronics Revenue by Product Segment (% Share), 2014 Figure40Rohm Revenue by Geography (% Share), 2014 Figure41Rohm Revenue by Product Segment (% Share), 2014 Figure42Omnivision Technologies Revenue by Sales Channel (%Share), 2014 Figure43Vishay Intertechnology Revenue by Segment (% Share), 2014 Figure44Vishay Intertechnology Revenue by Region (% Share), 2014 Figure45Vishay Intertechnology Revenue by End-Use Market (% Share), 2014 Figure46Vishay Intertechnology Revenue by Sales Channel (% Share), 2014 Figure47Fairchild Semiconductor Revenue by Country (% Share), 2014 Figure48First Sensor Revenues by Region (%Share), 2014
To Enquire About the Report Click Here KEY INSIGHTS Light and proximity sensors based on the estimation are expected to grow to a $1.7billion industry by 2017 due to steady rise in the market for handheld devices. The segment with least market size is IR sensors according to analysis. It is due to the gradual decrease in the use of infrared sensors as advanced sensors with higher accuracy and sensitivity are being launched into the market. Global Optical sensor market is slated to grow at 9.8% CAGR year on year for next 5 years. The global Image sensor market is expected to grow at a 11% CAGR with CMOS sensors occupying more than 90% share Optical sensors will play a crucial role in IoT market, to provide better control of devices thus driving the market for them in the future.
To Enquire About the Report Click Here RESEARCH METHODOLOGY The quantitative and qualitative data collected for the global Optical Sensors report is from a combination of secondary and primary sources. Research interviews were conducted with executives and/or mangers in the key product manufacturers and related organizations. These Key Opinion Leaders (KOLs) were then provided a questionnaire to gather quantitative and qualitative inputs on their operations, performance, strategies and views on the overall market, including key developments and trends. Data from interviews is consolidated, checked for consistency and accuracy, and the final market numbers are again validated by experts. The global Optical Sensors was split by grades of polycarbonate resins, applications and geography based on different factors like primary and secondary sources, understanding of the number of companies operating in each segment and also KOL insights. We have used various secondary sources such as directories, articles, white papers, newsletters, annual reports and paid databases such as OneSource, Hoovers and Factiva to identify and collect information for extensive commercial study of the global Optical Sensors. The approach towards finding information regarding the market and forecasting has been quite extensive. The key players in the market and its value chain were identified through secondary research and their market opinions were also gathered in a similar way through telephonic interviews and questionnaires. Interviews with key opinion leaders such as managers and marketing personnel were used extensively in understanding the need and emergence of polycarbonate resin market. We also have extensive database of contacts which were used to conduct primary interviews and also to get their inputs using questionnaires.
To Enquire About the Report Click Here THE ARC ADVANTAGE An analytical model lies at the core of our process, ensuring logical consistency throughout our research. We complement the model with secondary data and interviews with industry experts to reflect the latest trends. With our final expert validation, we provide you with only the most accurate and actionable intelligence. THE ARC PROCESS Base Method Analytical Method Consolidation Method Delphi Verification 1. Granular breakdown of drivers into factors 2. Validate all factors in terms of their present impact on the market 3. Assign weights to these factors in terms of their relevance and impact on the market 4. Build the Analytical Model 1. Get a top- down estimate of the market 2. Follow it up with a bottom-up estimate of the market 3. Check forconsistency and new growth factors that are relevant over the next 10 Years 4. Build the Base model 1. Granular breakdown of drivers into factors 2. Validate all factors in terms of their present impact on the market. 3. Assign weights to these factors in terms of their relevance and impact on the market. 4. Build the Consolidated Model 1. Verify the findings of the model with experts from across the value chain 2. Verify the findings with players across small and large enterprises 3. Tweak the model and add new factors 4. Finalize the ARC Model ANALYTICAL MODEL BASE MODEL CONSOLIDATED MODEL ARC MODEL
To Enquire About the Report Click Here ABOUT US IndustryARC was started by a group of young, passionate professionals along with extensively experienced industry veterans across various business segments. Our focus and expertise is mainly in the field of analytics, market research and consulting. Our singular goal is to provide accurate and affordable research to our clients. Our research team has expertise in diverse fields like Automotive, Chemicals,Consumer Product & Services, Electronics, Food & Beverages, Healthcare etc., However diverse the expertise maybe, everyone in our team shares one common trait - we love data and we love providing solutions to clients using that data even more! Seeing your business flourish based on our solutions and strategy is what we love the most! IndustryARC publishes more than 30 reports on an annual basis in the mentioned Industries. Our reports are in-depth and high quality reports that can help decision makers frame better strategies for their business requirements. These reports can be further customized as per your needs. Disclaimer: The reports sold by IndustryARC are limited publications containing valuable market information provided to a select group of customers in response to orders. Our customers acknowledge and agree that any report bought from IndustryARC is for their own internal use and not for general publication or disclosure to third parties. Our reports or part of the reports, information contained in the report, cannot be shared or resold to any other third party. Disclosure to third parties, usage of data in a public document, article or blog by the customer can be done with prior permission taken from IndustryARC. For information regarding permissions and sales, contact: sales@industryarc.com | sanjay.matthews@industryarc.com
To Enquire About the Report Click Here IndustryARC +1 614 - 588 - 8538 sales@industryarc.com Copyright ©2015 IndustryARC All Rights Reserved. This document contains highly confidential information and is the sole property of IndustryARC. No part of it may be circulated, copied, quoted, or otherwise reproduced without the approval of IndustryARC.