Download
1 / 11
110 likes | 208 Views
High-resolution modelling in support of T-REX observations Simon Vosper and Peter Sheridan Met Office, UK T-REX Workshop, Boulder, April 2007. The Met Office Unified Model. Nested simulations performed with the Met Office Unified Model (UM).

E N D
High-resolution modelling in support of T-REX observations Simon Vosper and Peter Sheridan Met Office, UK T-REX Workshop, Boulder, April 2007.
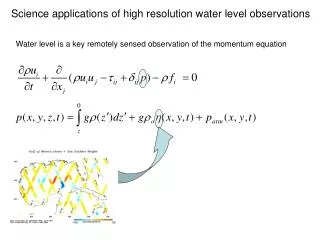
The Met Office Unified Model • Nested simulations performed with the Met Office Unified Model (UM). • The UM system makes use of the same numerical model in global and limited area configurations. • Dynamical core is based on fully compressible equations and uses semi-implicit time integration. • Semi-Lagrangian advection scheme. • Different physical parametrization schemes used depending on resolution. • Collaborative study involving NERC (Univ. Leeds) and Met Office use of FAAM BAe 146 research aircraft from 16 March to 9 April. • Surface based measurements include: AWS, lidars, radars, turbulence towers, sodars, radiosondes • Primary aim: To better understand the dynamics of rotors and the conditions under which they occur
High-resolution Unified Model simulations • Nested simulations for several IOP events (6, 8 and 10 so far): • Horizontal grid spacings: 40 km-12 km-4 km-1 km-333 m. • Dynamics settings (e.g. timesteps and off-centering time weights) made suitable for use at high resolution. • Smagorinsky turbulence scheme tested in some simulations. • Simulated gravity-wave fields compared against aircraft measurements.
IOP-6 25/26 March 2006 Vertical velocity (m/s) at 5 km ASL • 333 m horizontal resolution. • Large amplitude mountain waves. • Downslope winds penetrated into Owens Valley. Rotor motion observed. Vertical velocity (m/s) Owens Valley
IOP-6 25/26 March 2006 Zonal wind component (m/s)) • Flow separation occurs from valley floor • Zonal flow appears to show a classical rotor structure, but the structure of flow within the rotor is highly complex, 3-D and unsteady. • In general the flow within the valley has a strong southerly component. Vertical velocity (m/s) Reversed flow Owens Valley Separation point
IOP-6: Valley floor winds 10 m wind speed (m/s) and flow vectors across Owens Valley nr Independence • Unsteady complex structure. • Gustiness in valley during downslope wind event connected with small-scale eddies shed from Sierra slopes. Accelerated flow across Sierras Downslope winds penetrate into valley Eddies shed into valley
Comparisons with aircraft data: IOP-6 • Model predictions are out of phase with observed vertical velocity field. The primary downdraught (above Sierra lee-slope) is generally too far upwind in model.
Comparisons with aircraft data: IOP-10 • Close agreement between observed and simulated vertical velocity field.
Summary • High-resolution (333 m) simulations exhibit many of the features observed during T-REX e.g. downslope winds, flow separation and rotors. • For the weaker amplitude cases (IOPs 8 and 10) the model predictions of mountain waves agree closely with aircraft observations. Both the amplitude and phase of the waves are well represented. • For large amplitude (nonlinear) IOP-6 case the agreement is less close. In particular the primary downdraught (above the eastern Sierra slope) is located too far upwind in the model, giving rise to large phase errors. • For IOP-6 the sensitivity of the flow to upwind parameters is being investigated, but early results using radiosonde profiles to represent the upwind flow suggest the phase errors are not very sensitive to the profile – are the large amplitude waves less predictable?
Summary continued. • In all cases, comparison of results obtained with Dx=1 km with Dx=333 m show a lack of convergence for the gravity waves when Dx=1 km • The Dx=1 km gravity wave amplitudes are too weak. • Comparisons with results from a fully explicit Eulerian model (BLASIUS) show this is a feature of the UM only • When the mountains are shrunk (by a factor of 10) the discrepancy between Dx=1 km and Dx=333 m goes away! • The weak waves at 1 km resolution may be due to: • Poor handling of flow separation (and hence the way the waves are forced). • Spurious forcing with steep orography due to truncation errors and the large-scale pressure gradient in a terrain following system.
Future Work and collaborations? • Further sensitivity tests • Why can’t we represent the waves adequately at 1 km resolution in the UM? • How predictable are the large amplitude IOP-6 waves e.g. how sensitive is the wave field to changes in the upstream flow? • How does the UM do compared to other models e.g. COAMPS? • Can we use the simulations to shed light on the complex 3-D structure of rotors? • How realistic are the simulated rotor structures? Comparisons with lidar, radar and AWS data.