Download
1 / 28
320 likes | 604 Views
Estimation of Air Handling Units Condensate Recovery in the Medical Campus Buildings at the University of Alabama at Birmingham Presented by Atul Kajale 1 , Robert W. Peters 1 , Matthew Winslett 2 1 Civil , Construction, and Environmental Engineering University of Alabama at Birmingham

E N D
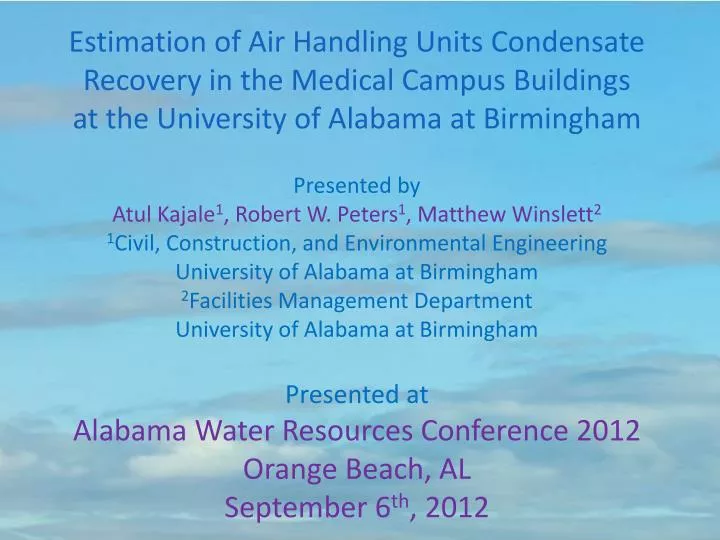
Estimation of Air Handling Units Condensate Recovery in the Medical Campus Buildings at the University of Alabama at Birmingham Presented by AtulKajale1, Robert W. Peters1, Matthew Winslett2 1Civil, Construction, and Environmental Engineering University of Alabama at Birmingham 2Facilities Management Department University of Alabama at Birmingham Presented at Alabama Water Resources Conference 2012 Orange Beach, AL September 6th, 2012
Overview Introduction Problem Statement and Objectives Literature Review Methodology Results and Discussion
Introduction • Air Handling Units (AHUs) • Part of Heating, Ventilating, and Air Conditioning (HVAC) system • Used in commercial, industrial, and institutional buildings • because it can handle large volumes of air • During cooling season (summer), chilled water is used for cooling • the hot outside air • Condensate Recovery • Collection and reuse of condensate formed inside the AHU • Save money by reusing condensate water as make-up water in • the chilled water plant, irrigation, toilet flushing (water • conservation technique), etc. • Achieve both water and energy conservation goals
Problem Statement • Currently, there is no accurate method to predict the amount of condensate amount from Air Handling Units (AHUs). • The previous models typically underestimate (~30%) the condensate volumes and hence there is need for improvement in the estimation method. • Due to this, there is error in estimation of the payback period so it is difficult to evaluate the feasibility of a Condensate Collection System • No previous research has been performed for the Birmingham, Alabama location
Problem Statement • Hypotheses • Null Hypothesis: The amount of condensate water predicted using the current study and the previous studies are the same. • Alternate Hypothesis: The amount of condensate water predicted using the current study and the previous studies are not the same. • Questions to be addressed: • What is the interaction of various parameters on condensate recovery? • Is the CCS feasible for the Birmingham location? • What is the quality of condensate water? • How much make-up water is required and • supplied?
Problem Statement • To develop a more accurate method for predicting the condensate recovery quantity from AHU condensation; • To determine the factors affecting the condensate production rate (including interaction terms); • To analyze the quality of the condensate water and its application for on-campus activities; and • To determine resulting water savings, payback period, Life Cost Assessment (LCA) and Life Cycle Cost (LCC) analysis
Introduction (cont’d) Intensity of Drought in Southeastern U.S., August 2007 Figure 1. Intensity of Drought in Southeastern U.S., August 2007 (Source: U.S. Drought Monitor, University of Nebraska, Lincoln 2011)
Introduction (cont’d) Water Scarcity and Drought Condition Feb. 14, 2012 March 20, 2012 May 29, 2012 July 24, 2012 Figure 2. Intensity of Drought in Alabama in Year 2012 (Source: U.S. Drought Monitor, University of Nebraska, Lincoln 2012)
Introduction (cont’d) Water Scarcity and Drought Condition • Future water availability is based on: • current water usage data at the county level, • energy usage, • population, • economic developments, and • sixteen established climate models. Figure 3. Water Supply Sustainability of Projected Demand in Year 2050 under Changing Climatic Scenario (Source: Sujit Roy, TetraTech Inc., 2010)
Introduction (cont’d) Water Scarcity and Drought Condition Figure 5. Effect of population on fresh water withdrawals in Alabama. (U.S. Geological Survey, 2005)
Introduction (cont’d) • Water Scarcity and Drought Condition • “Drought is a natural event that does not occur in a violent burst • but gradually happens; furthermore, the duration and extent of • drought conditions are unknown because rainfall is • unpredictable in amount, duration and location” (Office of • Water Resources, ADECA, Alabama, 2004) • Social, economical, and environmental effects • Slow response, and unpreparedness in mitigation • Commercial, and industrial operators to lower their water consumption • There is a need to grow water conservation awareness, and a need for more research to develop effective water conservation techniques that are unique to the local conditions of the area.
Literature Review • Background Studies • Several CCS projects have been installed in the recent past, only 3 studies performed detailed analysis • Bahrain Airport Services in the Middle East recycles 2.3 million gallons of condensate water every year for toilets flushing, washing, and landscaping. • EPA's Environmental Services Branch Laboratory in Houston, Texas, collects 832,000 gallons of water every year, project cost of $6,000,saved $20,000 over past 6 years • National Air and Radiation Environmental Laboratory (NAREL), Montgomery, Alabama installed CCS, help facility to reduce water use by 800,000 gallons annually, 65% of facility’s water use. Expected to save 1 million gallons of water annually.
Literature Review • Background Studies • Formula used by Karen Guz (2005) • Formula used by Bryant and Ahmed (2008) to estimate the • quantity of condensate water is stated as below: where, CFM=volumetric air flow in cubic feet per minute ΔT= temperature difference across the chilled water cooling in °F
Literature Review • Background Studies • Model developed by Lawrence et al. under this study is given below: where: Δώis the difference in absolute humidity between the incoming outdoor air and the supply air leaving the unit. • The observed amount of condensate collected was 171,793 gallons, and the predicted amount was 134,021 gallons (28% lower)
Literature Review • Factors Affecting the Production of Condensate Rate Geographical Location and Hot and humid weather Figure 6. Condensate Collection Potential in United States. Lawrence and Perry, (2010)
Literature Review • Factors Affecting the Production of Condensate Rate • Building use and occupancy • Typical office, classroom, retail buildings require large amounts • of outside air but part of it is always re-circulated • Hospitals, manufacturing process plants, storage buildings, • Laboratories require 100% outside air in every air exchange • The greater the volume of air supply rate, the greater the • amount of condensate generated as it depends on the relative • humidity
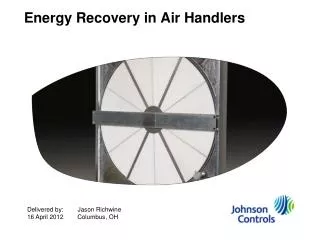
Methodology Figure 8. Schematic of the Condensate Recovery System.
Methodology • Parameters of Interest • Condensate water collected • Temperature, • Dry bulb temperature • Dew point temperature • Relative humidity • Air supply rate • Intake air volume per exchange • Area of the building served by the air handler • Capacity of the air handler
Methodology All Buildings utilize 100% outside air
Results Condensate Water Collection: Kaul AHU #4 June 2012 July 2012
Results Condensate Water Collection: Kaul AHU #4
Results Condensate Water Collection: Kaul AHU #4
Results Effect of weather parameters Q = f1 (Tdry), f2 (RH), f3 (Pbar), f4 (CPMairsupply rate) Interaction of weather parameters Q = f5(combination of Tdry, RH, Pbar, CPMairsupply rate ) Q = aT+bRH+cPbar+dCPMairsupply rate +error
Results Condensate Water Quality Analysis Preliminary water quality analysis conducted in April 2011
Discussion • It is expected that model developed during this study will provide more accurate predictions of condensate volumes – less than 15% difference in predicted and observed values is expected • Over 1.4 million gallons of water is recovered in 2.5 months which is equivalent to a saving of $5900. • More accurate payback period calculations • Preliminary water quality analysis suggests no treatment to water except for fungi and algae • Interaction of temperature, relative humidity, air supply rate, pressure on condensate production will be examined and a best fit equation will be developed • Knowledge of the environmental performance of the project
Acknowledgement • Dr. Robert W. Peters, Ph.D., P.E., Department of Civil, Construction, • and Environmental Engineering at The University of Alabama at • Birmingham. • Mr. Matt Winslett, Energy Management Division of Facilities Management at The University of Alabama at Birmingham for proving technical information and for allowing access to the different buildings and for funding this project. • Sigma Xi – The Scientific Research Society for the Grants-in-Aid of Research for equipment purchase
Thank You!!! Questions???