Download
1 / 65
670 likes | 880 Views
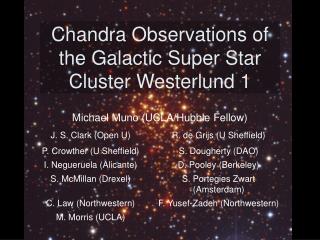
Westerlund 1. Starburst in our backyard. Ignacio Negueruela. Santiago 2006. This work is carried out in collaboration with. J. Simon Clark Open University (UK). Paul A. Crowther, Simon P. Goodwin University of Sheffield (UK) Michael Muno University of California, Los Angeles (USA)

E N D
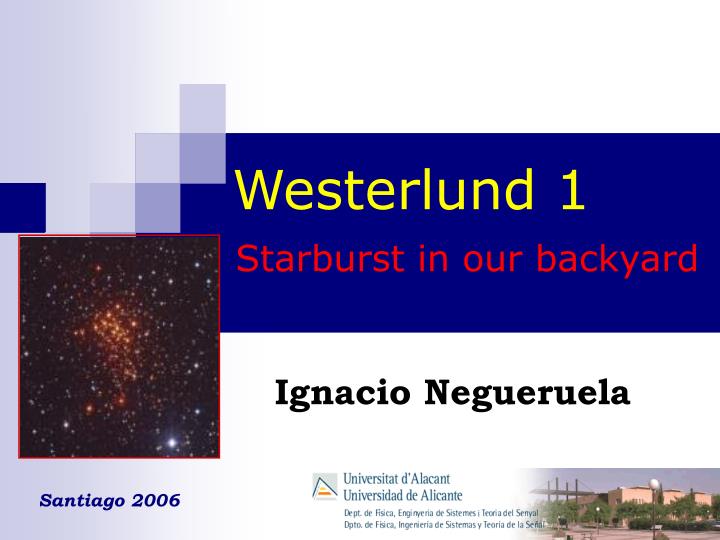
Westerlund 1 Starburst in our backyard Ignacio Negueruela Santiago 2006
This work is carried out in collaboration with J. Simon Clark Open University (UK) Paul A. Crowther, Simon P. Goodwin University of Sheffield (UK) Michael Muno University of California, Los Angeles (USA) Wolfgang Brandner Max-Planck-Institut für Astronomie (Germany) Sean M. Dougherty Dominion Radio Astrophysical Observatory (Canada) Rens Waters Astronomical Institute ``Anton Pannekoek'‘ (The Netherlands)
Outline • Introduction: modes of star formation in the Milky Way and other galaxies. • The observations: finding Westerlund 1 • The implications: the size of Westerlund 1 and what we are learning from it.
Star formation in the solar neighbourhood The field stellar population in the solar neighbourhood has a wide range of ages. We observe star formation taking place preferentially in relatively small molecular clouds (such as Bok globules), which form small unbound groups of intermediate and low-mass stars.
This mode of star formation appears dominant in local star-forming regions, such as the Taurus-Auriga and Ophiuchi clouds. Image from ISO press release (ESA) Figure from Mamajek et al. 1997 (ApJ 516, L77)
Many such groups contain one intermediate-mass Herbig Ae/Be star and several T Tauri stars. Image by Lynne Hillenbrand, Caltech Massive stars are not generally produced in these small groups.
Open clusters Clusters in the solar neighbourhood (Orion Spur, Perseus and Sagittarius Arms) generally have masses in the 102 - 103 M range. Battinelli & Capuzzo-Dolcetta (1991, MNRAS 249, 76), from analysis of 100 clusters within 2kpc, find that the typical mass of a Galactic cluster is 500 M.
The number of embedded clusters suggests that ~90% of stars are formed in proto-clusters, but ~90% of the proto-clusters disperse before becoming optically visible (Lada & Lada 2003, ARA&A 41,57) In most clusters the IMF has a broad maximum around ~0.6 M Images from Lada & Lada (2003)
There appears to be a good statistical correlation between the total mass of the cluster and the mass of the most massive star (Elmegreen 1983, MNRAS 203, 1011). Such correlation is believed to stem from the size of the molecular clouds and could be a statistical rather than physical effect (Larson 1982, MNRAS 200, 159). • Lada & Lada (2003) estimate a formation rate for open clusters in the solar neighbourhood • R = (2-4) kpc-2 Myr-1
In order to form some massive stars, a total mass 103 Mis necessary. The classical example is the Orion Nebula Cluster, where the Trapezium contains four massive stars, including 1 Ori C (O6Vpe). The total mass in the molecular cloud associated with M42 is 105 M, implying that only a small fraction of the gas is being turned into stars. Images from HST archive (NASA)
As massive stars are known to be very disruptive for their parental clouds, it is generally believed that they form relatively late compared to low-mass stars in the same cluster. Image by David Hanon • Likewise, it is believed that clusters containing OB stars form in the outskirts of massive clouds and then give rise to unbound OB associations via triggered star formation (e.g, Elmegreen 1983).
This is generally assumed to be the reason why, though star formation proceeds on a typical scale comparable to the size of a giant molecular cloud (~80 pc, Efremov 1995, AJ 100, 2757), Milky Way massive clusters tend to be much smaller. Image taken from class by James Schombert, University of Oregon
Massive clusters • The most massive clusters in the disk of the Milky Way have typical masses approaching (but not quite reaching) 104 Min stars. These clusters are born with several (10-20) O-type stars and later evolve into supergiant-rich clusters, such as h Per. By this stage, they have already blown out all rests of its parental cloud, as indicated by the lack of differential reddening (e.g., Marco & Bernabeu 2001, A&A 372, 477).
The total mass of h & Persei is 3700 + 2800 M in stars more massive than the sun (M > 1M), with a normal Salpeter’s IMF down to this range (Slesnick et al. 2002, ApJ 576, 880). Interestingly, this sort of massive clusters tend to appear in complexes, such as IC 1805 & IC 1848, or the Carina complex Tr 14/16 + Cr 228 + Tr 15 + NGC 3293.
It doesn’t have to be like this ... The 30 Dor star forming region in the LMC is 1kpc across and contains the 30-Dor cluster, spanning 40pc. Its central region, the R136 cluster is 2.7 pc across and contains 3600 stars more massive than M > 2.4M (Hunter et al. 1996, ApJ 459, L27), indicating a mass of 4x10⁴ M in stars more massive than M > 1M. Image from HST archive (NASA)
The central region of R136 is so dense that it was believed to be a single super-massive star until resolved by HST. Images from HST archive (NASA) Similar stellar densities are observed in young globular clusters, such as NGC 1850.
Starburst phenomena Images from HST archive (NASA) Enhanced star formation is seen in a wide variety of galaxies, both irregular and spiral. Starburst irregular galaxy NGC 4214 Spiral starburst galaxy NGC 3310 Spiral starburst galaxy NGC 4314
Starburst activity in the Antennae: over one thousand massive clusters being formed Images from HST archive (NASA) Collisions and other forms of galaxy interaction seem to be related to large bursts of star formation. Enhanced star formation in Stephen’s quintet
Super star clusters • Ultradense HII regions (Johnson 2002, ASP Conf. 267, p. 307): • Masses up to a few 106M. • Ionising luminosities N ~1053 s-1 • Size appears correlated to intensity of starburst. • A continuum of masses from typical Galactic clusters to the most massive super-clusters. • Larsen (2004, ASP Conf. 322, p.19) • Whitmore (2000, ASP Conf. 197, p. 315) Image of M51 from HST archive (NASA)
Star formation in the past • There are strong indications that star formation was more widespread and stronger in the distant past. • Stellar populations have mostly originated in starburst. How can we learn about it? Images from HST archive (NASA)
Searching for massive clusters in the Milky Way • NGC 6303 - 6-8 x10³M. A very young and compact object (Moffat et al. 1994, ApJ 436, 183), containing O3f and WR-like stars. • Cyg OB2 - nearby area of star formation with 4-10 x104M. Very massive, but very extended (60 pc). (Knödlseder 2000, A&A 360, 539; Comerón et al. 2002, A&A 389, 874 ). Perhaps not so massive (Hanson 2003, ApJ 597, 957) Images from HST archive (NASA)
Galactic Centre clusters • Quintuplet, Arches. Massive and compact clusters. • Galactic Centre “cluster” • The Arches has many massive stars, some with M> 100 M. (e.g., Figer et al. 2002, ApJ 581, 258) • The Arches has a top-heavy IMF (Stolte et al. 2002, A&A 394, 459). Images from HST archive (NASA)
Galactic Centre clusters • The Arches has a top-heavy IMF. • Severe depletion of intermediate- and low-mass stars (Stolte et al. 2005, ApJ 628, L113) • Total mass M < 104M. Very obscured. Special conditions? NACO three-colour image from Stolte et al. (2005)
The W49 star-forming region • Again, a very extended area of star formation. • Very massive, but distributed in several clusters. • The most massive one has 100-140 O-type stars (Alves & Homeier 2003, ApJL, 589, 45)
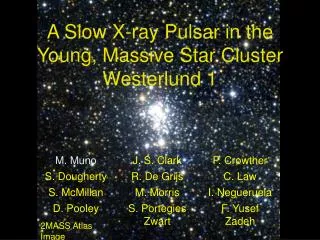
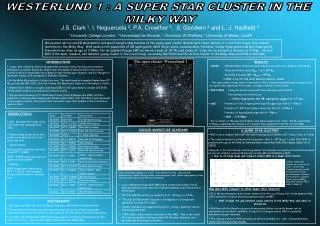
Westerlund 1 • Discovered by Bengt Westerlund in 1961 (PASP, 73, 51) in red plates - very reddened • Westerlund later found several blue, yellow and red supergiants, some very luminous (1987; A&AS 70, 311) • Two solutions proposed: 1) DM 13 with AV 11 (Westerlund ‘87) 2) DM 11 with AV 13 (Piatti et al. 1998, A&AS 127, 423) • Clark et al. (1998; MNRAS 295, L43) found extended radio emission associated with two stars
Westerlund 1 • Discovered by Bengt Westerlund in 1961 (PASP, 73, 51) in red plates - very reddened • Westerlund later found several blue, yellow and red supergiants, some very luminous (1987; A&AS 70, 311) • Two solutions proposed: 1) DM 13 with AV 11 (Westerlund ‘87) 2) DM 11 with AV 13 (Piatti et al. 1998, A&AS 127, 423) • Clark et al. (1998; MNRAS 295, L43) found extended radio emission associated with two stars
V/(V-I) diagram (from Westerlund ‘87) Foreground Wd 1 Westerlund used photographic plates for photometry and derived absorption from low-resolution spectra.
Piatti et al. obtained integrated spectroscopy. Their spectrum shows the signature of late-type SGs, from where they inferred an age ~8 Myr. Image from Piatti et al. (1998)
Westerlund 1 • Discovered by Bengt Westerlund in 1961 (PASP, 73, 51) in red plates - very reddened • Westerlund later found several blue, yellow and red supergiants, some very luminous (1987; A&AS 70, 311) • Two solutions proposed: 1) DM 13 with AV 11 (Westerlund ‘87) 2) DM 11 with AV 13 (Piatti et al. 1998, A&AS 127, 423) • Clark et al. (1998; MNRAS 295, L43) found extended radio emission associated with two stars
WN stars WC stars Clark & Negueruela (2002; A&A 396, L25)
1 arcmin L A K B J C H D G E F WN stars WC stars Clark & Negueruela (2002; A&A 396, L25)
3-cm radio map These data are courtesy of Sean Dougherty.
3-cm radio map These data are courtesy of Sean Dougherty.
3-cm radio map These data are courtesy of Sean Dougherty.
NTT/SUSI2 data Local population Wd 1 AGB Clark et al. (2005; A&A 434, 949)
Intermediate resolution spectroscopy Taken on June 2002, 7th NTT+EMMI Red arm • Grating 6 • 0.36 A/pixel • 8200-8900 • Grating 7 • 0.84 A/pixel • 6300-7800
Hypergiant candidates • The four YHG candidates from Westerlund (1987) are indeed extremely luminous: • Wd-16 A3Ia • V=15.9, MV =-9.7 • Wd-12 A7Ia • V=16.9, MV =-9.8 • Wd-4 F2Ia • V=14.4, MV =-10.0 • Wd-265 F5Ia • V=17.1, MV =-9.5
A candidate LBV Wd-243 Variable spectrum around A0Ia (Clark & Negueruela 2004, A&A 413, L15)
The stellar content of Wd 1 as seen from the NTT • 3 radio-bright M SGs • 2 A-type HGs • 2 F-type HGs • A few very luminous B, A and F SGs • 1 LBV candidate • 1 emission-line something • 2 bright Ofpe/WNL • 17 WR stars • 23 OB SGs Clark et al. (2005; A&A 434, 949) Negueruela & Clark (2005; A&A 436, 541)
VLT observations • FORS2, 1 night in June 2004 • ISAAC high resolution spectroscopy mode, 2 nights in June 2004 and 3 nights in June 2005 • NACO, a few hours in service mode 2003 • Others coming
As OB supergiants do FORS2 MXU observations with G1200R and G1028z There are well over 100 OB supergiants in Wd 1
WN stars FORS2 MOS observations with G150I
A rich variety of everything … Very luminous late-B SG Weird early B emission-line objects (quiescent LBVs?) Luminous B3Ia stars