Download
1 / 18
200 likes | 279 Views
TECHNICAL EFFICIENCY AND PRODUCTIVITY ANALYSIS OF SPANISH CITRUS FARMS. Fatima Lambarraa, Teresa Serra and José M. Gil Centre de Recerca en Economia i Desenvolupament Agroalimentaris, CREDA-UPC-IRTA. PRESENTATION OUTLINE. I. THE RELEVANCE OF THE CITRUS SECTOR II. OBJECTIVE

E N D
TECHNICAL EFFICIENCY AND PRODUCTIVITY ANALYSIS OF SPANISH CITRUS FARMS Fatima Lambarraa, Teresa Serra and José M. Gil Centre de Recerca en Economia i Desenvolupament Agroalimentaris, CREDA-UPC-IRTA
PRESENTATION OUTLINE I. THE RELEVANCE OF THE CITRUS SECTOR II. OBJECTIVE III. METHODOLOGY OF ANALYSIS IV. EMPIRICAL APPLICATION V. EMPIRICAL RESULTS VI. CONCLUDING REMARKS
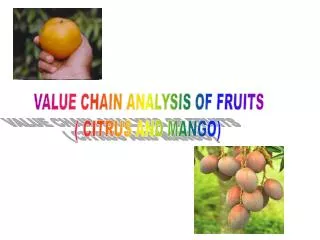
I. RELEVANCE OF CITRUS SECTOR AND MOTIVATION The leading citrus fruit producing countries are Brazil, the Mediterranean countries, the United States and China. Within the Mediterranean area, Spain is the first producer with more than 5.9 million tons (57% of EU production and 6% of the worldwide production). Oranges are the most relevant citrus fruit produced in Spain (48% of EU production and 5% of worldwide production).
I. RELEVANCE OF CITRUS SECTOR AND MOTIVATION Citrus fruits are the first fruit crop in international trade in terms of value with more than 10 millions tons in 2004. The EU is the main destination as well as the main supply region, with almost half of the world imports and more than 40% of world exports. The Mediterranean region plays a prominent role as a world fresh citrus exporter (60% of global fresh citrus fruits exports). Spain is the first exporting country with almost 25% of total exports in the world (FAO 2005).
II. OBJECTIVE • The objective of this study is to analyze the Technical Efficiency (TE) for a sample of Spanish farms specialized in citrus production and … • To decompose Total Factor Productivity (TFP) growth into its various components (using a primal approach).
III. METHODOLOGY OF ANALYSIS Stochastic frontier model To measure the TE with which farms are operating, we use the stochastic frontier methodology (SFM) (Aigner, Lovell and Schmidt 1997, Meusen and Van den Broeck 1977 ) : We consider the general stochastic production frontier function in the presence of panel data: where~& ~
III. METHODOLOGY OF ANALYSIS Stochastic frontier model captures the effects of statistical noise outside the firm's control is a one-sided, non-negative component associated with output-oriented technical inefficiencies. Weadopt the temporal pattern of technical inefficiencyby Battese and Coelli (1992): . Where ξ captures the temporal variation of individual output-oriented technical efficiency ratings, and
III. METHODOLOGY OF ANALYSIS Decomposition of TFP growth We measure productivity change and determine its various sources following the primal approachby Kumbhakar and Lovell (2000): Where: Technical change:
III. METHODOLOGY OF ANALYSIS Scale component: Where: & Allocative inefficiency: Where: & Technical efficiency change:
IV. EMPIRICAL APPLICATION We use farm-level data taken from the FADN (Farm Accounting Data Network) for the period 1995-2002. We also use regionally aggregated derived from the Spanish Ministry of Agriculture (MAPA) & Eurostat (MAPA provided land prices & Eurostat provided other input and output price indices). We chose our sample of farms from the specialist citrus fruits group. Specifically, we concentrate on those farms whose orange sales represent more than 70% of citrus sales. Our sample is composed by 859 observations. We use Frontier 4.1 to estimate SFM & SAS 9.1 to decompose TFP Change.
IV. EMPIRICAL APPLICATION The production frontier function is approximated by the quasi-Translog functional form (Fan, 1991): Xit : (1x4) vector of inputs X1: Fertilizers and pesticides, X2: Other variable crop-specific inputs, X3: Hectares occupied by olive groves, X4: Labor input measured in labor hours per year.
V. EMPIRICAL RESULTS Table 1.Maximum Likelihood Estimates of the Production Frontier Function Production function Technical inefficiency model Note:L refers to labour, K to Land, F to Fertilizers and O to other costs. * indicate that the parameter is significant at 5%.
V. EMPIRICAL RESULTS Table 2.Output Elasticities for Spain citrus-Growing Farms, 1995-2003
V. EMPIRICAL RESULTS Table 3. Model Specification Tests for citrus farms Constant returns-to-scale, i.e., and Hicks-neutral technical change, i.e., Zero-technical change, i.e.,
V. EMPIRICAL RESULTS Table 4. Measures of Technical Efficiency for Spanish citrus farms, 1995-2003
V. EMPIRICAL RESULTS Table 5.Decomposition of TFP Growth for Spanish citrus Farms
VI. Concluding Remarks Our analysis assesses the efficiency and productivity growth of Spanish farms specialized in citrus produce. The Spanish citrus sector production function is characterized by decreasing returns to scale, making the increase of farm size unattractive. Results of the Stochastic frontier model suggest an improvement in efficiency levels during the period studied, from 53% in 1995 to 69% in 2003. The estimated average efficiency level is about 64.11% with 38% of farms in the sample reaching a score greater than 80%.
VI. Concluding Remarks The TFP growth indicates an increase in average productivity of about 2.7 % per year during the period of study. Technical efficiency change, allocative inefficiencies and scale effects constitute the most relevant components of this growth.