Download
1 / 63
650 likes | 879 Views
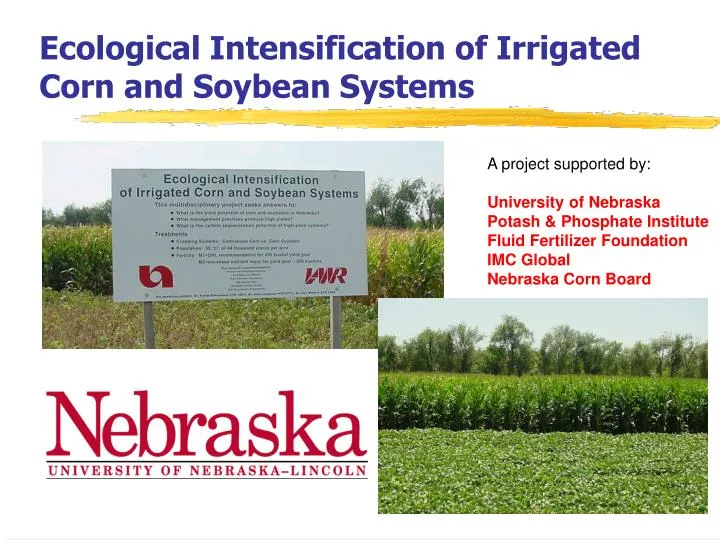
Ecological Intensification of Irrigated Corn and Soybean Systems. A project supported by: University of Nebraska Potash & Phosphate Institute Fluid Fertilizer Foundation IMC Global Nebraska Corn Board. Definitions, Concepts, Considerations. Crop Yield Potential (Yp). What is it?

E N D
Ecological Intensification of Irrigated Corn and Soybean Systems A project supported by: University of Nebraska Potash & Phosphate Institute Fluid Fertilizer Foundation IMC Global Nebraska Corn Board
Crop Yield Potential (Yp) What is it? Theoretically achievable yield solely determined by genetic characteristics and climate (solar radiation, temperature). How to measure it? (a) Calculated from components of yield and radiation use efficiency. (b) Estimated by crop simulation models. How to achieve it? Fully-controlled, small-scale experiment to eliminate all biotic and abiotic stresses (water, nutrients, pests). How to increase it? (a) Breeding/germplasm improvement (b) Management: optimization of planting date in relation to variation in Yp due to the seasonal pattern of radiation and temperature.
Variability of Crop Yield Potential Annual variation of the simulated corn yield potential at Lincoln, NE Source: J. Lindquist & D. Walters, UNL Ecological Intensification Project
Variability of Crop Yield Potential Effect of planting date on corn yield potential at Lincoln, NE Source: J. Lindquist & D. Walters, UNL Ecological Intensification Project
Attainable Crop Yield Potential (Ya) What is it? Yield that can be achieved by minimizing abiotic and biotic stresses through the best available technology at a given site in a typical production field. How to measure it? (a) Yield achieved in high-quality research experiments. (b) Yield achieved by yield contest winners. How to achieve it? Optimize all soil and crop management to achieve high use efficiencies of solar radiation, water and nutrients. Minimize yield losses due to insects, diseases, weeds. How to increase it? (a) Improve soil quality (gradual process). (b) Improve crop management (learning process)
Yield Potential, Actual Yield, Profit and Resource Use Efficiency A average response curve B increase in yield potential (Yp) C increase in input use efficiency D increase in Yp and input use efficiency Prices: Corn $1.80/bu N $0.15/lb N Appl. $6.00/acre/appl. A & B: 1 N application C & D 2 N applications
Yield Potential, Actual Yield, Profit and Resource Use Efficiency A B increase in yield potential
Yield Potential, Actual Yield, Profit and Resource Use Efficiency A C increase in input use efficiency A D increase in Yp and input use efficiency
Yield Potential, Actual Yield, Profit and Resource Use Efficiency Optimal N rate: A & B 162 lb/acre C & D 200 lb/acre A average response curve B increase in yield potential (Yp) C increase in input use efficiency D increase in Yp and input use efficiency
Yield Potential, Actual Yield, Profit and Resource Use Efficiency lb N/acre for max yield lb N/acre for max profit A average response curve B increase in yield potential (Yp) C increase in input use efficiency D increase in Yp and input use efficiency
Yield Potential, Actual Yield, Profit and Resource Use Efficiency bu yield per lb N applied (PFP-N) bu yield increase over unfertilized control per lb N applied (AE-N) A average response curve B increase in yield potential (Yp) C increase in input use efficiency D increase in Yp and input use efficiency
Why do we Need to Conduct Research on Understanding High Yields?
Average vs. Attainable Soybean Yields Source: modified from Specht et al., Crop Sci. 39 (1999), 1560-1570.
Average vs. Attainable Soybean Yields Source: modified from Specht et al., Crop Sci. 39 (1999), 1560-1570.
How Does Soil Productivity Affect the Attainable Yield Potential? Corn, Ohio (1992-95) Source: Johnson et al., 1999
What Causes the Variability of Yield in Relation to Inputs and Management? Same field in Lincoln, NE (1996-99)
Environmental Issues: Nitrate Irrigated corn, Davis, CA Source: Broadbent & Carlton, 1978
0 2 4 6 8 10 12 14 16 18 20 0 200 400 600 800 1000 1200 1400 1600 1800 2000 Environmental Issues: Nitrate Clay Center, NE, 18-yr LTE Continuous Corn Depth, m Corn-Soybean Cumulative Nitrate-N, kg ha-1 Source: UNL, SCREC
Environmental Issues: C Sequestration Average of long-term experiments, USA Source: T.O. West, ORNL, CSiTE project, 2000 (http://csite.esd.ornl.gov)
Environmental Issues: C Sequestration Dryland crop rotation, Akron, CO, 1984-94 (11 crops) Source: Halvorson et al, Soil Sci. Soc. Am. J. 63 (1999), 912-917.
Environmental Issues: N2O Emission Typical N2O emission from agricultural land: • 1 to 2 kg N2O/ha per year • less than 1% of N applied Median N2O emission (% of N applied): • Anhydrous ammonia 1.63% (range: 0.9-6.8) • Ammonium nitrate 0.40% (range: 0.04-1.7) • Ammonium sulfate (chloride) 0.15% (range: 0.02-1.7) • Urea 0.11% (range: 0.01-0.6) • Nitrate 0.05% (range: 0.01-1.8) Sources: Bockman (1994), Eichner (1990)
Global N fertilizer use (1999) Million t N % World: Total N 83.0 100 Urea 39.6 48 Ammonium nitrate 7.0 8 Anhydrous ammonia 4.5 5 Liquid N 4.2 5 Other straight N 14.8 18 Compound N 12.9 16 % of global USA: Total N 11.3 100 14 Urea 1.8 16 5 Ammonium nitrate 0.6 5 9 Anhydrous ammonia 3.6 32 80 Liquid N 2.8 25 67 Other straight N 0.3 3 2 Compound N 2.2 19 17 Source: IFADATA, 2000
Kellogg Station, Michigan (1991-99) Environmental Issues: Global Warming Relative net global warming potential (g CO2 equiv /m2/yr)* *Includes: soil C, N fertilizer, Lime, Fuel, N2O, CH4 Source: Robertson et al., Science 289 (2000), 1922-1925.
What Do We Know About Growing Corn at Attainable Yield Potential Levels? Yield contest winners: • Continuous corn system (no rotation!) • Deep soils with soil fertility built up to very high levels. • Deep tillage (12-14’’). • High plant density (41,000 to 44,000 plants/acre). • Slow planting speed (2 mph); accurate plant spacing, less than 2% skips. • P, and K fertilizer inputs exceed average recommendations. • Careful N management: Fall application for residue breakdown, narrow band pre-plant N application (10’’ apart), starter fertilizer, sidedressing. • Frequent scouting and excellent pest control.
What Do We Know About Growing Corn at Attainable Yield Potential Levels? Knowledge gaps: • Basic scientific understanding of yield-determining processes and how they are affected by management. • Solid scientific basis for efficient extrapolation to other locations (avoid trial and error). • Knowledge of how to design optimal systems managed at 70-80% of the yield potential. • Lack of studies that integrate productivity, profitability, and environmental consequences of high yield systems.
Objectives • Quantify the yield potential of irrigated corn and soybean. Understand the physiological processes determining it. • Identify cost-effective and environmentally friendly crop management practices to achieve irrigated corn and soybean yields that approach potential levels. • Determine how changes in soil quality affect the ability to achieve yields that approach yield potential levels. • Quantify the energy use efficiency, soil C-sequestration and net radiative forcing potential of intensive corn and soybean management systems.
Ecological Intensification Project: Examples of the Questions Addressed • What is the yield and biomass potential of soybean and corn under irrigated conditions? • How much do current photosynthesis and stored carbohydrate stalk reserves contribute to grain yield at high yield levels? • Can we increase radiation and N use efficiency as we move yields up from present average yields to attainable yield levels? • What are the nutrient requirements to achieve genetic yield potential and how do they change with the yield level? • Do we need to increase soil quality to achieve optimal nutrient- and water-use efficiency at yield potential levels? How much? • What are the environmental consequences (nitrate loss, N2 emission, energy consumption, etc.) of high input systems required for achieving yields that approach yield potential levels? • What is the C-sequestration and net global warming potential of irrigated corn systems?
Key Investigators Timothy J. Arkebauer Environmenal crop physiology Robert M. Caldwell Soybean ecophysiology & modeling Kenneth G. Cassman Crop physiology and plant nutrition Rhae A. Drijber Soil microbial ecology Achim Dobermann Soil fertility and plant nutrition John L. Lindquist Corn ecophysiology & modeling John P. Markwell Biochemistry Lenis A. Nelson Plant breeding and crop production William Powers Soil physics Kenneth W. Russell Corn genetics James E. Specht Soybean genetics Daniel T. Walters Soil fertility, C sequestration
Crop rotation (main plots) CC Continuous corn CS Corn - soybean SC Soybean - corn Plant population (subplots) P1 corn: 30,000 plants/acre soybean: 150,000 plants/acre P2 corn: 37,000 plants/acre soybean: 185,000 plants/acre P3 corn: 44,000 plants/acre soybean: 220,000 plants/acre Management intensity (sub-subplots) M1 recommend fertilizer management based on soil testing corn: UNL recommendation for 200 bu/acre yield goal M2 intensive management aimed at yields close to yield potential (higher fertilizer rates, micronutrients, N applied in 3 splits) Corn yield goal = 300 bu/acre Irrigation: Drip irrigation Soil: siCL, pH 5.0-5.7, SOM 2.4-3.1%, P (Bray) 55-78 ppm, K 275-480 ppm Experimental Details: Lincoln, NE
Corn: Grain Yield 1999 Source: UNL Ecological Intensification Project (not for citation without permission).
Corn: N uptake 1999 Source: UNL Ecological Intensification Project (not for citation without permission).
Corn: P uptake 1999 Source: UNL Ecological Intensification Project (not for citation without permission).
Corn: K uptake 1999 Source: UNL Ecological Intensification Project (not for citation without permission).
Nutrient Uptake Requirements Based on 1999 data Source: UNL Ecological Intensification Project (not for citation without permission).
Corn: Total Biomass 2000 Source: UNL Ecological Intensification Project (not for citation without permission).
Corn: Grain Yield 2000 Source: UNL Ecological Intensification Project (not for citation without permission).
Corn: N uptake 2000 Source: UNL Ecological Intensification Project (not for citation without permission).
Corn: Biomass Dynamics INTERCOM model 37,000 plants/acre No constraints other than T and radiation. Source: J. Lindquist, UNL Ecological Intensification Project (not for citation without permission).
Possible Causes of Lower Attainable Yield in 2000 versus 1999? • Late-season high (night) temperatures causing increased maintenance respiration and shorter grain filling period? • Over-expression of vegetative biomass growth in relation to the actual yield potential? • Non-linear relationship between leaf-N, respiration rate, and temperature? • Mild water stress due to high vapor pressure deficit or imperfect irrigation? • Early insect damage? Subtle yield losses from undetected diseases?
Growth and Development • 19992000 • Emergence to anthesis 59 d 67 d • Anthesis to maturity 56 d 45 d • Total growth period 115 d 112 d Source: J. Lindquist, UNL Ecological Intensification Project (not for citation without permission).