Download
1 / 17
360 likes | 1.39k Views
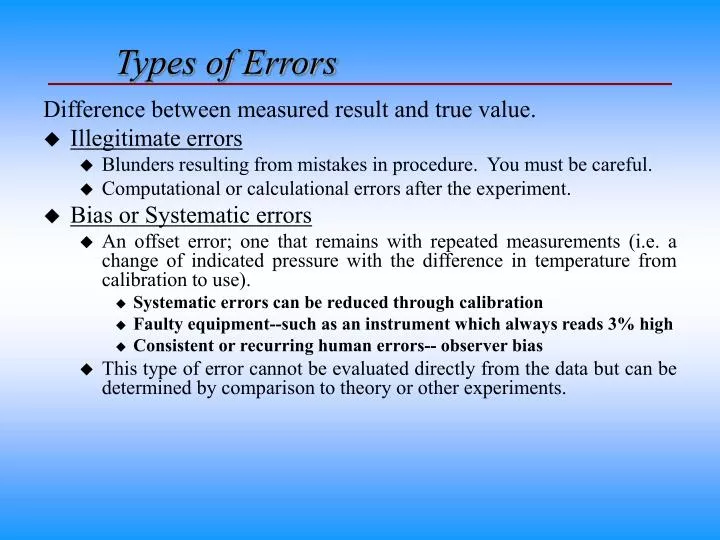
Types of Errors. Difference between measured result and true value. Illegitimate errors Blunders resulting from mistakes in procedure. You must be careful. Computational or calculational errors after the experiment. Bias or Systematic errors

E N D
Types of Errors Difference between measured result and true value. • Illegitimate errors • Blunders resulting from mistakes in procedure. You must be careful. • Computational or calculational errors after the experiment. • Bias or Systematic errors • An offset error; one that remains with repeated measurements (i.e. a change of indicated pressure with the difference in temperature from calibration to use). • Systematic errors can be reduced through calibration • Faulty equipment--such as an instrument which always reads 3% high • Consistent or recurring human errors-- observer bias • This type of error cannot be evaluated directly from the data but can be determined by comparison to theory or other experiments.
Types of Errors (cont.) • Random, Stochastic or Precision errors: • An error that causes readings to take random-like values about the mean value. • Effects of uncontrolled variables • Variations of procedure • The concepts of probability and statistics are used to study random errors. When we think of random errors we also think of repeatability or precision.
Bias, Precision, and Total Error Total Error Bias Error Precision Error X True X measured
Uncertainty Analysis • The estimate of the error is called the uncertainty. • It includes both bias and precision errors. • We need to identify all the potential significant errors for the instrument(s). • All measurements should be given in three parts • Mean value • Uncertainty • Confidence interval on which that uncertainty is based (typically 95% C.I.) • Uncertainty can be expressed in either absolute terms (i.e., 5 Volts ±0.5 Volts) or in percentage terms (i.e., 5 Volts ±10%) (relative uncertainty = DV / V x 100) • We will use a 95 % confidence interval throughout this course (20:1 odds).
How to Estimate Bias Error • Manufacturers’ Specifications • If you can’t do better, you may take it from the manufacturer’s specs. • Accuracy - %FS, %reading, offset, or some combination (e.g., 0.1% reading + 0.15 counts) • Unless you can identify otherwise, assume that these are at a 95% confidence interval • Independent Calibration • May be deduced from the calibration process
Use Statistics to Estimate Random Uncert. • Mean: the sum of measurement values divided by the number of measurements. • Deviation: the difference between a single result and the mean of many results. • Standard Deviation: the smaller the standard deviation the more precise the data • Large sample size è • Small sample size (n<30) • Slightly larger valueè
The Population • Population: The collection of all items (measurements) of the group. Represented by a large number of measurements. • Gaussian distribution* • Sample: A portion of (or limited number of items in) a population. • *Data do not always abide by the Gaussian distribution. If not, you must use another method!!
If you cannot use Statistics to Estimate Random Uncertainty -- i.e. only one sample • Use the instrument precision error as a last resort
Student t-distribution (small sample sizes) • The t-distribution was formulated by W.S. Gosset, a scientist in the Guinness brewery in Ireland, who published his formulation in 1908 under the pen name (pseudonym) “Student.” • The t-distribution looks very much like the Gaussian distribution, bell shaped, symmetric and centered about the mean. The primary difference is that it has stronger tails, indicating a lower probability of being within an interval. The variability depends on the sample size, n.
Student t-distribution • With a confidence interval of c% • Where a=1-c and n=n-1 (Degrees of Freedom) • Don’t apply blindly - you may have better information about the population than you think.
Example: t-distribution • Sample data • n = 21 • Degrees of Freedom = n = 20 • Desire 95% Confidence Interval • a = 1 - c = 0.05 • a/2 = 0.025 • Student t-dist chart • t=2.086
Estimate of Precision Error is Then: • Precision error is • ±0.23 Volts
How to combine bias and precision error? • Rules for combining independent uncertainties for measurements: • Both uncertainties MUST be at the same Confidence Interval (95%) • Precision error obtained using Student’s-t method • Bias error determined from calibration, manufacturers’ specifications, smallest division.
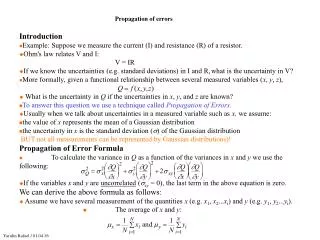
Propagation of Error • Used to determine uncertainty of a quantity that requires measurement of several independent variables. • Volume of a cylinder = f(D,L) • Volume of a block = f(L,W,H) • Density of an ideal gas = f(P,T) • Again, all variables must have the same confidence interval.
RSS Method (Root Sum Squares) • For a function y = f(x1,x2,...,xN), the RSS uncertainty is: • First determine uncertainty of each variable in the form ( xN ± DxN) • Use previously established methods, including bias and precision error.
Example Problem: Propagation of Error • Ideal gas law: • Temperature • T±DT • Pressure • P±DP • R=Constant How do we estimate the error in the density?
Apply RSS formula to density relationship: Apply a little algebra: