Download
1 / 78
780 likes | 895 Views
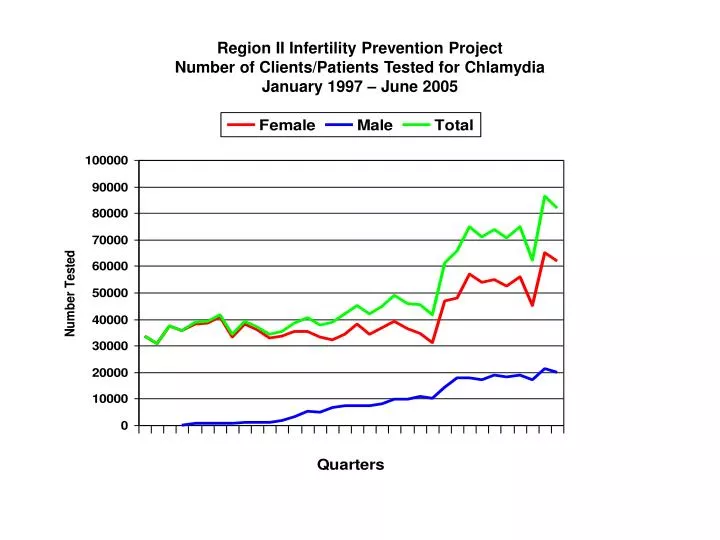
Region II Infertility Prevention Project Number of Clients/Patients Tested for Chlamydia January 1997 – June 2005. Region II Infertility Prevention Project Percent of Clients/Patients Testing Positive for Chlamydia January 1997 – June 2005.

E N D
Region II Infertility Prevention ProjectNumber of Clients/Patients Tested for ChlamydiaJanuary 1997 – June 2005
Region II Infertility Prevention ProjectPercent of Clients/Patients Testing Positive for ChlamydiaJanuary 1997 – June 2005
Region II Infertility Prevention ProjectWomen Tested for ChlamydiaJanuary 2005 – June 2005Total Tests = 127,219 – 5.6% Positive
Region II Infertility Prevention ProjectNumber of Clients/Patients Tested for ChlamydiaJanuary 2005 – June 2005
Region II Infertility Prevention ProgramPercent of Women Testing Positive for Chlamydiaby Project Area and Provider TypeJanuary 1, 2005 – June 30, 2005
Region II Infertility Prevention ProjectNumber of Chlamydia Tests for Women Reported from Detention CentersJanuary 2005 – June 2005 • New Jersey - 186 Tests, 53 (28.5%) Positive • New York City - 405 Tests, 44 (10.9%) Positive • New York State - 342 Tests, 35 (10.2%) Positive • Puerto Rico - 49 Tests, 8 (16.3%) Positive • Region II – 982 Tests, 140 (14.3%) Positive
Region II Infertility Prevention ProjectPercent of Women Testing Positive for Chlamydiaby Project and Provider TypeJanuary 1, 2005 – June 30, 2005 N=34,244 N=23,941 N=54,559 N=12,717 N=1,758 N=127,219
Region II Infertility Prevention ProjectPercent of Women Testing Positive for Chlamydiaby Age and Provider TypeJanuary 1, 2005 – June 30, 2005 N=127,219 N=73,210 N=97,806 N=27,908 N=923
Region II Infertility Prevention ProjectPercent of Women Testing Positive for Chlamydiaby Age Group and Provider TypeJanuary 1, 2005 – June 30, 2005 N=25 N=731 N=29,060 N=45,030 N=23,542 N=27,908
Region II Infertility Prevention ProjectPercent of Women Testing Positive for Chlamydiaby Race and Provider TypeJanuary 1, 2005 – June 30, 2005 N=1,243 N=1,780 N=32,048 N=91 N=49,139 N=29,484 N=12,889 N=248 N=127,219
Region II Infertility Prevention ProgramPercent of Women Testing Positive for Chlamydiaby Ethnicity and Provider TypeJanuary 1, 2005 – June 30, 2005 N=43,936 N=68,191 N=15,092
Region II Infertility Prevention ProgramPercent of Women that Tested Positive for Chlamydia AlsoTesting Positive for Gonorrhea, by Provider Type and Project AreaJanuary 1, 2005 – June 30,2005 N= FP 1,447 FP 172 FP 96 FP 1,715 STD 296 STD 130 STD 31 STD 457 Other 257 Other 331 Other 100 Other 688 Total 2,000 Total 633 Total 227 Total 2,860
Region II Infertility Prevention ProgramPercent of Women that Tested Positive for Chlamydia AlsoTesting Positive for Gonorrhea, by Provider Type and Age GroupJanuary 1, 2005 – June 30, 2005 N=55 N=1,130 N=1,051 N=358 N=217 N=47 N=2,860
Region II Infertility Prevention ProgramPercent of Women Testing Positive for ChlamydiaReported by Other Provider Type by Clinic TypeJanuary 1, 2005 – June 30, 2005
Region II Infertility Prevention ProgramType of Specimen/Source Collected from Women for Chlamydia Testingas Percent of Total Specimens Collected by Year1998 – 2005* *January through June 2005.
Region II Infertility Prevention ProgramPercent of Women Testing Positive for Chlamydia by Calendar Year andType of Specimen/Source Collected 1998 – 2005* *January through June 2005
Region II Infertility Prevention ProgramType of Specimen Collected from Women for Chlamydia TestingJanuary 1, 2005– June 30, 2005 N=120,560 N=303 N=4,783 N=1,572
Region II Infertility Prevention ProgramType of Specimen Collected from Women for Chlamydia Testingand Percent Positive by Test Type*January 1, 2005 – June 30, 2005 N=120,560 N=303 N=4,783 N=1,572 * Test Types that did not have positive results within a specimen type were not plotted.
Region II Infertility Prevention ProgramType of Specimen Collected from Women for Chlamydia TestingJanuary 1, 2005 – March 31, 2005 N=61,903 N=165 N=2,242 N=889
Region II Infertility Prevention ProgramType of Specimen Collected from Women for Chlamydia Testingand Percent Positive by Test Type*January 1, 2005 – March 31, 2005 N=61,903 N=135 N=2,242 N=889 * Test Types that did not have positive results within a specimen type were not plotted.
Region II Infertility Prevention ProgramType of Specimen Collected from Women for Chlamydia Testingand Percent Positive by Test Type*April 1, 2005 – June 30, 2005 N=58,657 N=138 N=2,541 N=683 * Test Types that did not have positive results within a specimen type were not plotted.
Region II Infertility Prevention ProjectMen Tested for ChlamydiaJanuary 1, 2005 – June 30, 2005Total Tests = 41,069 – 10.4% Positive
Region II Infertility Prevention ProjectPercent of Men Testing Positive for Chlamydiaby Project and Provider TypeJanuary 1, 2005 – June 30, 2005 N=5,628 N=18,466 N=14,961 N=1,871 N=143 N=41,069
Region II Infertility Prevention ProgramPercent of Men Testing Positive for Chlamydiaby Project Area and Provider TypeJanuary 1, 2005 – June 30, 2005
Region II Infertility Prevention ProjectChlamydia Tests for Men Reported from Detention CentersJanuary 1, 2005 – June 30, 2005 • New Jersey – 1311 Tests, 139 (10.6%) Positive • New York City – 1697 Tests, 109 (6.4%) Positive • New York State – 4692 Tests, 210 (4.5%) Positive • Region II – 7700 Tests, 458 (5.9%) Positive
Region II Infertility Prevention ProjectPercent of Men Testing Positive for Chlamydiaby Age and Provider TypeJanuary 1, 2005 – June 30, 2005 N=41,069 N=17,823 N=25,685 N=14,887 N=404
Region II Infertility Prevention ProjectPercent of Men Testing Positive for Chlamydiaby Age Group and Provider TypeJanuary 1, 2005 – June 30, 2005 N=25 N=599 N=6,502 N=10,913 N=7,739 N=14,887
Region II Infertility Prevention ProjectPercent of Men Testing Positive for Chlamydiaby Race and Provider TypeJanuary 1, 2005 – June 30, 2005 N=480 N=359 N=15,085 N=5 N=8,472 N=5,037 N=11 N=11,601 N=41,069
Region II Infertility Prevention ProgramPercent of Men Testing Positive for Chlamydiaby Ethnicity and Provider TypeJanuary 1, 2005 – June 30, 2005 N=7,256 N=20,202 N=13,611
Region II Infertility Prevention ProgramPercent of Men that Tested Positive for Chlamydia AlsoTesting Positive for Gonorrhea, by Provider Type and Project AreaJanuary 1, 2005 – June 30, 2005 N= FP 143 FP 6 FP 6 FP 155 STD 361 STD 143 STD 40 STD 544 Other 262 Other 14 Other 3 Other 279 Total 766 Total 163 Total 49 Total 978
Region II Infertility Prevention ProgramPercent of Men Testing Positive for ChlamydiaReported by Other Provider Type by Clinic TypeJanuary 1, 2005 – June 30, 2005
Region II Infertility Prevention ProjectWomen Tested for ChlamydiaJanuary 1, 2005 – March 31, 2005Total Tests = 65,200 – 5.7% Positive
Region II Infertility Prevention ProgramPercent of Women Testing Positive for Chlamydia by Quarter and ProviderOctober 1, 2003 – March 31, 2005
Region II Infertility Prevention ProgramPercent of Women Testing Positive for Chlamydia by Quarter and ProviderOctober 1, 2003 – March 31, 2005
Region II Infertility Prevention ProgramPercent of Women Testing Positive for Chlamydiaby Project Area and Provider TypeJanuary 1, 2005 – March 31, 2005
Region II Infertility Prevention ProjectPercent of Women Testing Positive for Chlamydiaby Project and Provider TypeJanuary 1, 2005 – March 31, 2005 N=17,132 N=12,330 N=28,796 N=5,877 N=1,065 N=65,200
Region II Infertility Prevention ProjectPercent of Women Testing Positive for Chlamydiaby Age and Provider TypeJanuary 1, 2005 – March 31, 2005 N=65,200 N=36,952 N=49,877 N=14,499 N=469
Region II Infertility Prevention ProjectPercent of Women Testing Positive for Chlamydiaby Age Group and Provider TypeJanuary 1, 2005 – March 31, 2005 N=13 N=316 N=14,425 N=23,164 N=12,314 N=14,499
Region II Infertility Prevention ProjectPercent of Women Testing Positive for Chlamydiaby Race and Provider TypeJanuary 1, 2005 – March 31, 2005 N=509 N=881 N=15,655 N=50 N=24,455 N=14,770 N=113 N=8,767 N=65,200
Region II Infertility Prevention ProjectPercent of Women Testing Positive for Chlamydiaby Ethnicity and Provider TypeJanuary 1, 2005 – March 31, 2005 N=20,941 N=34,797 N=9,462
Region II Infertility Prevention ProgramPercent of Women that Tested Positive for Chlamydia AlsoTesting Positive for Gonorrhea, by Provider Type and Project AreaJanuary 1, 2005 – March 31, 2005 N= FP 741 FP 91 FP 64 FP 896 STD 146 STD 68 STD 17 STD 231 Other 145 Other 159 Other 46 Other 340 Total 1,032 Total 318 Total 127 Total 1,477
Region II Infertility Prevention ProgramPercent of Women that Tested Positive for Chlamydia AlsoTesting Positive for Gonorrhea, by Provider Type and Age GroupJanuary 1, 2005 – March 31, 2005 N=25 N=575 N=539 N=200 N=117 N=20 N=1,477
Region II Infertility Prevention ProgramPercent of Women Testing Positive for ChlamydiaReported by Other Provider Type by Clinic TypeJanuary 1, 2005 – March 31, 2005
Region II Infertility Prevention ProjectMen Tested for ChlamydiaJanuary 1, 2005 – March 31, 2005Total Tests = 21,210 – 10.6% Positive
Region II Infertility Prevention ProgramPercent of Men Testing Positive for Chlamydia by Quarter and ProviderOctober 1, 2003 – March 31, 2005
Region II Infertility Prevention ProjectPercent of Men Testing Positive for Chlamydiaby Project and Provider TypeJanuary 1, 2005 – March 31, 2005 N=2,765 N=9,764 N=7,825 N=773 N=83 N=21,210
Region II Infertility Prevention ProgramPercent of Men Testing Positive for Chlamydiaby Project Area and Provider TypeJanuary 1, 2005 – March 31, 2005
Region II Infertility Prevention ProjectPercent of Men Testing Positive for Chlamydiaby Age and Provider TypeJanuary 1, 2005 – March 31, 2005 N=21,210 N=8,952 N=13,157 N=7,769 N= 224
Region II Infertility Prevention ProjectPercent of Men Testing Positive for Chlamydiaby Age Group and Provider TypeJanuary 1, 2005 – March 31, 2005 N=23 N=241 N=3,142 N=5,681 N=4,130 N=7,769
Region II Infertility Prevention ProjectPercent of Men Testing Positive for Chlamydiaby Race and Provider TypeJanuary 1, 2005 – March 31, 2005 N=102 N=136 N=6,190 N=4 N=3,919 N=1,999 N=5 N=8,885 N=21,210