Download
1 / 1
50 likes | 317 Views
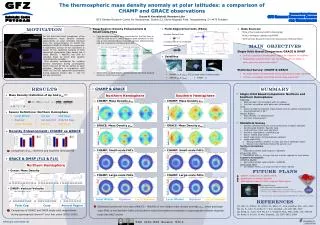
www.gfz-potsdam.de. Entropy-based method for optimal temporal and spatial resolution of gravity field variations Elisa Fagiolini and Christian Gruber

E N D
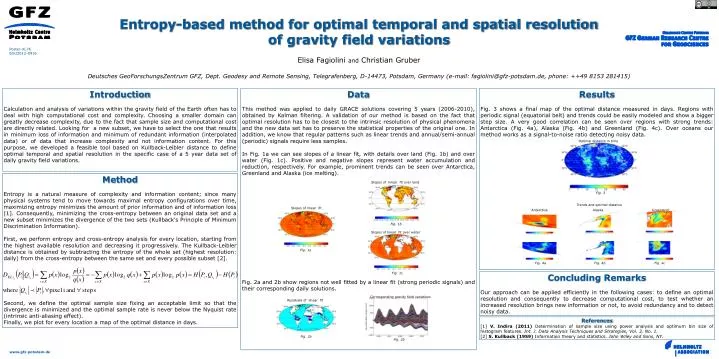
www.gfz-potsdam.de Entropy-based method for optimal temporal and spatial resolution of gravity field variations Elisa Fagioliniand Christian Gruber DeutschesGeoForschungsZentrum GFZ, Dept. Geodesy and Remote Sensing, Telegrafenberg, D-14473, Potsdam, Germany (e-mail: fagiolini@gfz-potsdam.de, phone: ++49 8153 281415) Poster-XL76EGU2012-8916 Introduction Calculation and analysis of variations within the gravity field of the Earth often has to deal with high computational cost and complexity. Choosing a smaller domain can greatly decrease complexity, due to the fact that sample size and computational cost are directly related. Looking for a new subset, we have to select the one that results in minimum loss of information and minimum of redundant information (interpolated data) or of data that increase complexity and not information content. For this purpose, we developed a feasible tool based on Kullback-Leibler distance to define optimal temporal and spatial resolution in the specific case of a 5 year data set of daily gravity field variations. Data This method was applied to daily GRACE solutions covering 5 years (2006-2010), obtained by Kalman filtering. A validation of our method is based on the fact that optimal resolution has to be closest to the intrinsic resolution of physical phenomena and the new data set has to preserve the statistical properties of the original one. In addition, we know that regular patterns such as linear trends and annual/semi-annual (periodic) signals require less samples. In Fig. 1a we can see slopes of a linear fit, with details over land (Fig. 1b) and over water (Fig. 1c). Positive and negative slopes represent water accumulation and reduction, respectively. For example, prominent trends can be seen over Antarctica, Greenland and Alaska (ice melting). Fig. 2a and 2b show regions not well fitted by a linear fit (strong periodic signals) and their corresponding daily solutions. Results Fig. 3 shows a final map of the optimal distance measured in days. Regions with periodic signal (equatorial belt) and trends could be easily modeled and show a bigger step size. A very good correlation can be seen over regions with strong trends: Antarctica (Fig. 4a), Alaska (Fig. 4b) and Greenland (Fig. 4c). Over oceans our method works as a signal-to-noise ratio detecting noisy data. Optimal distance in time Method Entropy is a natural measure of complexity and information content; since many physical systems tend to move towards maximal entropy configurations over time, maximizing entropy minimizes the amount of prior information and of information loss [1]. Consequently, minimizing the cross-entropy between an original data set and a new subset minimizes the divergence of the two sets (Kullback's Principle of Minimum Discrimination Information). First, we perform entropy and cross-entropy analysis for every location, starting from the highest available resolution and decreasing it progressively. The Kullback-Leibler distance is obtained by subtracting the entropy of the whole set (highest resolution: daily) from the cross-entropy between the same set and every possible subset [2]. Second, we define the optimal sample size fixing an acceptable limit so that the divergence is minimized and the optimal sample rate is never below the Nyquist rate (intrinsic anti-aliasing effect). Finally, we plot for every location a map of the optimal distance in days. Slopes of linear fit over land Fig. 3 Trends and optimal distance Slopes of linear fit Antarctica Alaska Greenland Fig. 1b Slopes of linear fit over water Fig. 1a Fig. 4a Fig. 4b Fig. 4c Fig. 1c Concluding Remarks Our approach can be applied efficiently in the following cases: to define an optimal resolution and consequently to decrease computational cost, to test whether an increased resolution brings new information or not, to avoid redundancy and to detect noisy data. Corresponding gravity field variations Residuals of linear fit References [1] V. Indira (2011) Determination of sample size using power analysis and optimum bin size of histogram features. Int. J. Data Analysis Techniques and Strategies, Vol. 3, No. 1. [2] S. Kullback (1959) Information theory and statistics. John Wiley and Sons, NY. Fig. 2a Fig. 2b