Download
1 / 40
420 likes | 552 Views
Estimating Soil Moisture Using Satellite Observations. By RamonVasquez. Contents. Introduction Some characteristics of the selected region Ground weather stations The algorithm to estimate volumetric soil moisture Partial results instrumentation. Introduction.

E N D
Estimating Soil Moisture Using Satellite Observations By RamonVasquez
Introduction • Some characteristics of the selected region • Ground weather stations • The algorithm to estimate volumetric soil moisture • Partial results • instrumentation
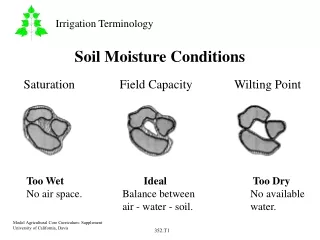
The soil moisture is an important parameter in climate modeling, its high variability occur on the firsts centimeters of top layer of soil surface.
South-West map of Puerto Rico and its weather stations, visualized by Arcmap software
Detailed vegetation types information Vegetation types
Combining vegetation, soil types, and elevation maps by use ERDAS software
Soil types • For this work will be useful obtain the map with the same sand and clay contents mainly. • This work part was done initially digitalizing in ArcView software. • Was performed for this proposal by joining equal classes
Resampling type soils Very detailed soil type information Less detailed soil type information
Soil Temperature Surface temperature Brightness temperature Effective Temperature Apparent emissivity Vegetation correction Vegetation Type (ndvi) Surface roughtness Roughness correction Inversion of Fresnel Equation Compute Soil moisture Soil texture Brightness temperature
Brightness Temperature The possible data sources to use are Band 3, 4 or 5 from NOAA satellite or L-band of SAR This temperature is obtained by considering that the radiance perceived by the sensor is coming from blackbody.
Brightness Temperature Brightness temperature from channel 3, NOAA satellite, this was achieved by use the Matlab software
Surface Temperature This parameter can be approximated fromair temperature near to the soil surface, may also be obtained from satellite images as follow, from NOAA, using 4 and 5 channels
Surface Temperature surface temperature image, from channel 3 NOAA satellite, this was achieved by use the Matlab software
Classified soil surface temperature This figure shows an image classified (unsupervised, ERDASsoftware) of an image of a thermal band of NOAA satellite. It shows levels of land surface temperature
Soil Temperature • The algorithm requires soil temperature for 10 to 15 cm of depth. This is Provided by experimental stations such as Maricao, Adjuntas, Guanica, and Cabo Rojo. • A difficult with this parameter is the little amount of data. For that it will be estimate by some empirical methods 1 and 2, this work consider the first method.
Soil Temperature • Method 1: • Assuming some degrees less than surface temperature • In presence of dense vegetation the surface and deep temperature almost the same • Method 2: • By training an artificial neural network, whose inputs are the following variables: • Vegetation type • Soil type • Elevation levels • Satellite observations on thermal frequency range The second method is considered for research
Apparent Emissitivity Due to signal attenuation, the emissivity isn’t real before making the correction e : apparent emissitivity R: apparent reflectivity
Wavelength (cm) C 49.0 0.084±0.005 2.8 0.802±0.006 6.0 0.667±0.008 11.0 0.480±0.010 21.0 0.246±0.009 Effective soil temperature • The net intensity (called the effective temperature) at the soil surface is a superposition of intensities emitted at various depths within the soil. • For remote sensing applications there are a simple form to obtain this effective soil temperature, mean look up table for C constant for the wavelength being used
Effective soil temperature This image (effective soil surface temperature) is generated in Matlab software using surface temperature and depth soil temperature (depth temperature is estimate by method 1 mentioned before), actually colors do not represent the real value.
Vegetation Correction This process is required to determine the initial radiation emitted by the soil surface which depending of transmisivity, there are more than two ways to determine the transmisivity, the simplest and practical way is mentioned here, • As first way to determine the transmisitivity is:
Vegetation Correction To get an estimation of VWC, there wasconsideredafunction piecewise defined depending of vegetation index (NDVI): • Another way, used for this work, more directly to obtain transsmisivity through vegetation is by considering NDVI too:
Vegetation Correction Then, when the transmissivity is already estimate, the reflectivity is corrected by
Vegetation Correction This image (NDVI) is generated in Matlab software using channels 1 and 2 of NOAA satellite, actually colors do not represent the real value (.
Apparent Emissitivity Due to signal attenuation, the emissivity isn’t real before making the correction, the following estimations for emissitivity and reflectivity are apparent, because its not considering the loses through signal trajectory: where e is the apparent emissitivity, and R is apparent reflectivity
Roughness Correction Where respectively Rs and Rr are reflectance of smooth and rough surface For this preliminary work, this parameter is estimate y considering the class of soil only, in each region with same soil characteristics.
Computing soil moisture • The relationship between volumetric soil moisture and dielectric constant was comprised in two distinct parts separated at a transition soil moisture value wt, where the wp is an empirical approximation of the wilting point moisture given by:
Compute the soil moisture For soil moisture less than wt:
Compute the soil moisture For soil moisture greater than wt:
The table bellow shows the quantitative characteristics of diferent places where the stations provide the data
The following is the values of soil moisture for different locations, given by the station and algorithm
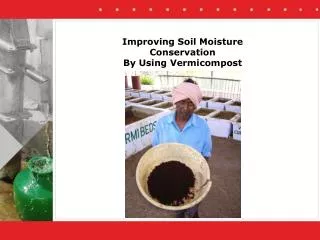
Theta prove ML2x This devise is a sensor to estimate volumetric soil moisture with ±1%accuracy
Data logger HH2 This devise is used to store information of sampling red by theta probe