Download

1 / 9
90 likes | 345 Views
COMING TO AMERICA. Nicola Azevedo Nicci Cazares Pearl Hatnagar Victoria Li Chris Sommerfeld. Coming to America. Hundreds of thousands of people get US permanent resident cards every year Around a third of these people decide to live in just five US cities Where are they coming from?

E N D
COMING TO AMERICA Nicola Azevedo NicciCazares Pearl Hatnagar Victoria Li Chris Sommerfeld
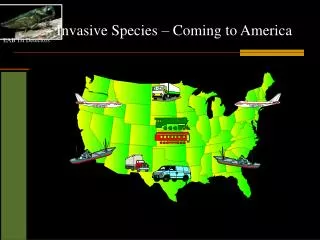
Coming to America Hundreds of thousands of people get US permanent resident cards every year Around a third of thesepeople decide to live in just five US cities Where are they coming from? Why are they choosing these cities?
Design process Explorations Data Gathering Prototypes Final Concept Followed an iterative design process Discussed our interests and ideas Prototyped and sketched approaches
Data hunting The US government publicly discloses counts of everyone who becomes a legal permanent resident They track this by US region as well as country of birth We looked at the five top US urban regions and the top 10 countries of origin for new legal residents
Laws of simplicity Reduce Organize Time Learn Differences Context Emotion Trust Failure The One Our work was informed by John Maeda’s “Laws of Simplicity” In our visualization we tried to reflect his maxim that “Simplicity is about subtracting the obvious, and adding the meaningful”
Visualizations Interactive bubble diagrams, maps and timelines informed our work as we looked for the best ways to visualize and explore the data The complexity of data led us to strip away much of the ornamentation and to focus on visualizing the changing volume of citizens from each country
Observations & insights It’s all really complicated—the quantitative data posed a lot more questions than it provided answers Correct and accurate data point-level analysis of this volume of aggregated data is virtually impossible While things stay more constant than not, there definitely are clear spikes and drop-offs Countryman tend to follow their own—Correlation? Causation?