Download
1 / 35
350 likes | 539 Views
Glenorchy City Council Performance Statistics Rates - actual rates levied 3 Percentage of rates Collected 3 Grants Revenue all Departments 4 Total Other Revenue 4 Operating Income Cumulative Variance to Budget 5 Accounts Receivable (Non-rates) 5 Annual Growth in AAV 6

E N D
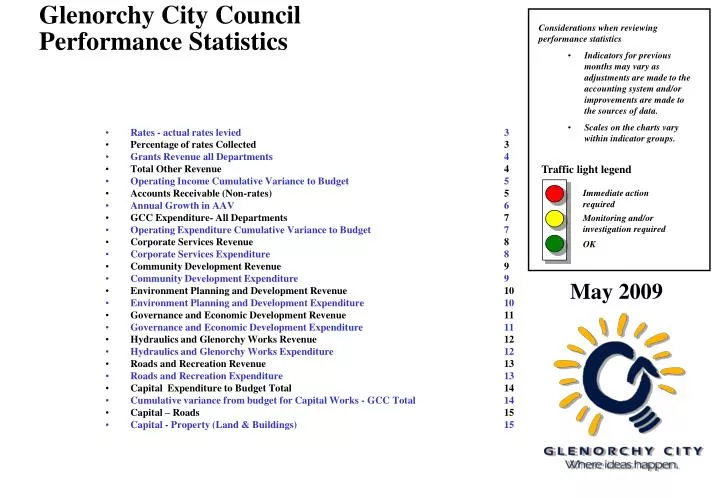
Glenorchy City Council • Performance Statistics • Rates - actual rates levied 3 • Percentage of rates Collected 3 • Grants Revenue all Departments 4 • Total Other Revenue4 • Operating Income Cumulative Variance to Budget 5 • Accounts Receivable (Non-rates) 5 • Annual Growth in AAV 6 • GCC Expenditure- All Departments 7 • Operating Expenditure Cumulative Variance to Budget 7 • Corporate Services Revenue 8 • Corporate Services Expenditure 8 • Community Development Revenue 9 • Community Development Expenditure 9 • Environment Planning and Development Revenue 10 • Environment Planning and Development Expenditure 10 • Governance and Economic Development Revenue 11 • Governance and Economic Development Expenditure 11 • Hydraulics and Glenorchy Works Revenue 12 • Hydraulics and Glenorchy Works Expenditure 12 • Roads and Recreation Revenue 13 • Roads and Recreation Expenditure 13 • Capital Expenditure to Budget Total 14 • Cumulative variance from budget for Capital Works - GCC Total 14 • Capital – Roads 15 • Capital - Property (Land & Buildings) 15 • Considerations when reviewing performance statistics • Indicators for previous months may vary as adjustments are made to the accounting system and/or improvements are made to the sources of data. • Scales on the charts vary within indicator groups. Traffic light legend Immediate action required Monitoring and/or investigation required OK May 2009
Additional information • Capital – Water 16 • Capital - Stormwater 16 • Capital - Treatment Plants 17 • Capital - Sewerage 17 • Capital - Other capital 18 • Infrastructure Non-Cash expenditure 18 • Cash flow trends 19 • Budgeted Staff cost to actual cost 20 • Actual wages & Salary all staff by Fortnight 20 • Additional Employment Costs 21 • Sick leave hours 22 • Sick leave by Department Indicator 22 • Total Reported Accidents, Incidents & Unsafe Work Conditions 24 • No Lost Time Injuries 24 • Lost time injuries 25 • Lost Hours per 1,000 hours worked 25 • Public Liability Claims 26 • Payment for Public Liability Claims 26 • Professional Indemnity Claims 27 • Payments for Professional Indemnity Claims 27 • Average Daily Water Consumption (Normal Consumers) 28 • Monthly Rainfall 28 • Total Cumulative Consumption of Water (Normal Consumers) 29 • Total cumulative cost of water against budget (Normal Consumer) 29 • Total Cumulative Consumption of Water (Special Consumers) 30 • Special Consumers Revenue 30 • APPENDIX A • Family Day Care Revenue & Expenditure 31 • Berriedale Child Care Centre Revenue & Expenditure 32 • Benjafield Child Care Centre Revenue & Expenditure 33 • Clydesdale Child Care Centre Revenue & Expenditure 34 • Claremont Outside School Hours Care Revenue & Expenditure 35 • APPENDIX B • Capital Project Exception Report 36
Responsible: Manager Corporate Services • Rates - Actual Rates Levied • Shows the actual Rates, Interest and Penalties compared to the budget for rates levied (invoiced). • The difference between invoiced rates and budgeted rates is made up of two parts supplementary valuations and interest and penalties accumulated during the year. • Actual YTD: $43,676,327 • Budget YTD: $43,803,800 • Budget 2008-09: $43,813,620 Under Budget: $ 127,473 Responsible: Manager Corporate Services • Percentage of Rates Outstanding • Shows the percentage amount of invoiced rates outstanding. • 31 May 2009: 1.40% • 31 May 2008: 2.26% • Variance: + 0.86% 3
Responsible: Corporate Management Team Grants Revenue for all Departments The total of grants revenue received from either the State or Commonwealth Governments. - Actual YTD : $6,195,883 - Budget YTD: $5,279,682 - Over Budget: $ 916,201 4
Responsible: Corporate Management Team • Total Other Revenue (Excluding Rates, Water & Grants) • The total operational revenue earned by all areas of the council through fees, charges and fines in comparison to the budgeted revenue. • Actual YTD $12,556,145 • Budget YTD $13,165,857 Refer to comments on pages 8-13 Responsible: Corporate Management Team • Cumulative Variance from Budget for Operating Income - GCC Total • The actual dollars over or under budget for the year to date. • Revenue finished $609,712 under budget Refer to comments on pages 8-13 5
Responsible: Manager Corporate Services • Accounts Receivable • A monthly summary of the level and distribution of money owing to the council in the non-rates areas. • Total May 2009 $531,134 • Total May 2008 $923,057 Difference - $391,923 Responsible: Manager Corporate Services • Annual Growth in the AAV for Glenorchy • A comparison of the annual growth in the Assessed Annual Value of the City (As assessed by the Valuer General) over the last 9 years. • Note: The city was revalued in 2005 AAV Growth 2008/09 Now 1.32% 6
Responsible: Corporate Management Team • Total Operating Expenditure (Including Cost of Water) • The total operating expenditure of all areas of the council in comparison to the budgeted expenditure. • Actual YTD $45,629,009 • Budget YTD $47,281,848 Responsible: Corporate Management Team • Cumulative Variance from Budget for Operating Expenditure - GCC Total • The actual dollars over or under budget for the year to date. • Expenditure finished $1,652,839 under budget. Refer to comments pages 8-13. 7
Responsible: Manager Corporate Services • Corporate Services Operating Revenue (non-rates) • The total operational revenue earned by Corporate Services through fees, charges and fines in comparison to the budgeted revenue. • Actual YTD $3,246,484 • Budget YTD $3,046,865 Over Budget $ 199,619 Responsible: Manager Corporate Services • Corporate Services Operating Expenditure • The total operating expenditure of Corporate Services in comparison to the budgeted expenditure. • Actual YTD $8,737,408 • Budget YTD $9,035,553 Under Budget $ 298,145 8
Responsible: Manager Community Development • Community Development Operating Revenue • The total operational revenue earned byCommunity Development through fees, charges and grants in comparison to the budgeted revenue. • Actual YTD $3,912,931 • Budget YTD $3,896,926 Over Budget $ 16,005 For more detail on Children’s Services Revenue see Appendix A Responsible: Manager Community Development • Community Development Operating Expenditure • The total operating expenditure of Community Development in comparison to the budgeted expenditure. • Actual YTD $5,385,217 • Budget YTD $5,585,405 • Under Budget $ 200,188 For more detail on Children’s Services Expenditure see Appendix A 9
Responsible: Manager Env. Planning & Dev • Environment, Planning and Development Operating Revenue • The total operational revenue earned by Environment, Planning and Development through fees, charges and fines in comparison to the budgeted revenue. • Actual YTD $5,720,489 • Budget YTD $6,094,957 Under Budget $ 374,468 Landfill revenue is significantly down. Responsible: Manager Env. Planning & Dev • Environment, Planning and Development Operating Expenditure • The total operating expenditure of Environment, Planning and Development in comparison to the budgeted expenditure. • Actual YTD $6,377,475 • Budget YTD $6,727,409 Under Budget $ 349,934 Majority of under expenditure relates to positions not being filled. 10
Responsible: General Manager and Manager Governance & Performance • Governance and Economic Development Operating Revenue • The total operational revenue earned by Governance, GM’s and Derwent Entertainment Centre through fees, charges and fines in comparison to the budgeted revenue. • Actual YTD $1,346,104 • Budget YTD $1,386,812 Under Budget $ 40,708 Responsible: General Manager and Manager Governance & Performance • Governance and Economic Development Operating Expenditure • The total operating expenditure of the Governance, GM’s and Derwent Entertainment Centre area in comparison to the budgeted expenditure. • Actual YTD $3,382,989 • Budget YTD $3,602,365 Under Budget $ 219,376 Non use of consultancy budgets has impacted on YTD expenditure. 11
Responsible: Manager Works & Hydraulics • Hydraulics and Glenorchy Works Centre Operating Revenue (No Water) • The total operational revenue earned by Hydraulics and Glenorchy Works through fees, charges and fines (Excluding revenue from special consumers) in comparison to the budgeted revenue. • Actual YTD $2,088,520 • Budget YTD $1,907,168 • Over Budget $ 181,352 Responsible: Manager Works & Hydraulics • Hydraulics and Glenorchy Works Centre Operating Expenditure (No Water) • The total operating expenditure of Hydraulics and Glenorchy Works Centre in comparison to the budgeted expenditure. (Excluding expenditure on Water) • Actual YTD $12,192,621 • Budget YTD $12,557,883 • Under Budget $ 365,262 12
Responsible: Manager Roads & Recreation • Roads and Recreation Operating Revenue • The total operational revenue earned by Roads and Recreation through fees, charges and fines in comparison to the budgeted revenue. • Actual YTD $2,437,500 • Budget YTD $2,112,811 Over Budget $ 324,689 RLCIP grant funding of $521,000 received. Mill Lane land sale is now not expected until next financial year ($454,000). Responsible: Manager Roads & Recreation • Roads and Recreation Operating Expenditure • The total operating expenditure of Roads and Recreation in comparison to the budgeted expenditure. (Excluding depreciation) • Actual YTD $3,743,517 • Budget YTD $3,996,430 Under Budget $ 252,913 Majority of under expenditure relates to salary savings, reduced maintenance and land sales development. 13
Responsible: Corporate Management Team • Capital Expenditure to Budget - GCC Total • Capital Expenditure to Budget for all areas of GCC is the actual amount paid to date in invoices and wages for Capital works. • Actual YTD $9,282,898 • Budget YTD $9,867,888 Refer pages 15-18 and Appendix B for further details. Responsible: Corporate Management Team • Cumulative Variance from Budget for Capital Works - GCC Total • The actual dollars over or under budget for the year to date. • Expenditure currently $584,990 under budget 14
Responsible: Manager Works & Hydraulics • Capital Expenditure to Budget - Roads • Capital Expenditure to Budget for Roads is the actual amount paid YTD in invoices & wages for Capital works related to Roads. • Actual YTD $5,255,923 • Budget YTD $5,532,543 Under Budget $ 276,620 Additional information regarding Capital variances is contained in Appendix B. Responsible: Manager Roads & Recreation • Capital Expenditure to Budget - Property • Capital Expenditure to Budget for Property is the actual amount paid to date in invoices and wages for Capital works related to Property. • Actual YTD $832,070 • Budget YTD $824,423 Over Budget $ 7,647 Additional information regarding Capital variances is contained in Appendix B. 15
Responsible: Manager Works & Hydraulics • Capital Expenditure to Budget - Water • Capital Expenditure to Budget for Water is the actual amount paid to date in invoices and wages for Capital works related to Water • Actual YTD $824,915 • Budget YTD $766,003 Over Budget $ 58,912 Additional information regarding Capital variances is contained in Appendix B. Responsible: Manager Works & Hydraulics • Capital Expenditure to Budget - Stormwater • Capital Expenditure to Budget for Stormwater is the actual amount paid to date in invoices and wages for Capital works related to Stormwater. • Actual YTD $1,525,965 • Budget YTD $1,793,407 Under Budget $ 267,442 Additional information regarding Capital variances is contained in Appendix B. 16
Responsible: Manager Works & Hydraulics • Capital Expenditure to Budget - Treatment Plants • Capital Expenditure to Budget for Treatment Plants is the actual amount paid to date in invoices and wages for Capital works related to the Treatment Plants. • Actual YTD $101,483 • Budget YTD $128,000 Under Budget $ 26,517 Additional information regarding Capital variances is contained in Appendix B. Responsible: Manager Works & Hydraulics • Capital Expenditure to Budget -Sewerage • Capital Expenditure to Budget for Sewerage is the actual amount paid to date in invoices and wages for Capital works related to Sewerage • Actual YTD $367,449 • Budget YTD $371,413 • Under Budget $ 3,964 Additional information regarding Capital variances is contained in Appendix B. 17
Responsible: General Manager • Capital Expenditure to Budget - Other Capital • Represents the actual amount paid to date in invoices & wages for Capital works related to Other Capital (Capital items not included in the previous categories, for example, technology, land-fill, planning etc.) • Actual YTD $375,093 • Budget YTD $452,099 Under Budget $ 77,006 Additional information regarding Capital variances is contained in Appendix B. Responsible: Corporate Management Team • GCC Expenditure –Total Non-Cash Assets • Depreciation reflects a charge made that ensures that the cost of an asset is spread over the expected life of that asset • Profit & Loss on retirement • Actual YTD $13,502,703 • Budget YTD $13,415,766 Over Budget $ 86,937 18
Responsible: Manager Corporate Services • Cash Flow Trends • Shows the total cash assets (Current account, cash floats and short term deposits) available, compared to previous years. • Cash Assets May 09: $17,714,877 Responsible: Manager Corporate Services • Council Net Debt Comparison • Shows the total net debt (Cash assets less loans), compared to previous years. A positive result occurs where cash held is greater than loans. • Net Debt May 09: ($855,289) • Hobart and Clarence Council figures are based on 2007/08 Annual Reports and included for comparison. 19
Responsible: Manager Corporate Services • Budgeted Staff Cost to Actual Cost (including on cost) • The cost of budgeted permanent employees of Council (does not include staff who are costed against capital or maintenance projects.) • Actual YTD $13,721,876 • Budget YTD $14,561,252 Under Budget $ 839,376 Responsible: Manager Corporate Services • Total Wages & Salary for all Staff by Fortnight. • The total cost of salaries and wages expended on staff, compared with the previous year. • 2008/09 costs YTD: $16,275,200 • 2007/08 costs YTD: $15,477,090 Increase on 2007/08: $ 798,110 20
Responsible: Manager Corporate Services • Additional Employment Costs • Illustrates the cost of casuals and overtime in comparison to the previous 2 years. • 2008/09 costs YTD: $625,482 • 2007/08 costs YTD: $625,954 Difference - $ 472 21
Responsible: Manager Corporate Services • Sick Leave Hours • The total number of sick leave hours claimed by GCC staff. • 2008/09 hours YTD: 16,353 • 2007/08 hours YTD: 15,893 Difference + 460 . Responsible: Manager Corporate Services • Sick Leave by Department Indicator • Comparisons are Provided for the Last Two Years. • Sick leave represented as a percentage of the total number of hours worked by permanent staff. • The State 05/06 KPI was 2.12% and the Cities 05/06 KPI was 2.42% for comparison. • GCC Average YTD: 3.48% • GCC Average YTD 2007-08: 3.58% 22
OccupationalHealth & Safety The following four charts relate to the number of reported accidents and injuries and the impact of these on Council. ‘Total Reported Accidents, Incidents and Unsafe Work Conditions’ indicates the level of Council’s proactive reporting and rectification of OH&S issues in the workplace. Each occurrence is fully investigated with the aim of preventing a reoccurrence that may lead to a Lost Time Injury. Lost Time Injuries (LTI) are the total number of all reported incidents, including unsafe work conditions that have resulted in lost time to the organisation. There is one long term claim for lost hours from last financial year that will continue to impact on this years figures. One worker, injured in a previous month required time off following surgery this month. 23
Responsible: Manager Corporate Services • Total Reported Accidents, Incidents and Unsafe Work Conditions. • Occurrences recorded in this chart resulted in no lost time or any medical expenses incurred. • 2008/09 total YTD: 31 • 2007/08 total YTD: 36 Refer to comments on page 23 Responsible: Manager Corporate Services • Total Reported No Lost Time Injuries • The total number of injuries that resulted in some medical costs being incurred but no time lost to council. • 2008/09 total YTD: 15 • 2007/08 total YTD: 7 Refer to comments on page 23 24
Responsible: Manager Corporate Services • Lost Time Injuries • The total number of injuries for which a workers compensation claim was submitted compared to the previous two years. • 2008/09 LTI YTD: 13 • 2007/08 LTI YTD: 18 Refer to comments on page 23 Responsible: Manager Corporate Services • Lost Hours per 1,000 Hours Worked • The number of hours lost due to injuries in the work place compared to the previous two years. • 2008/09 hours May: 5.30 • 2007/08 hours May: 7.60 • State 2005/06 KPI: 3.9 • Cities 2005/06 KPI: 4.4 Refer to comments on page 23 25
Responsible: Manager Corporate Services • Public Liability Claims • This shows the total number of pending and accepted liability claims, both body injury and property damage. • Claims YTD 2008-09: 25 4 Accepted 0 Pending - YTD there have been 21 claims denied by Council’s insurer (not shown on chart) • Accepted claims YTD 2007-08: 23 Responsible: Manager Corporate Services • Payments for Public Liability Claims • This shows the total amount paid by council each month for public liability claims. Council pays up to a maximum of $5,000 per claim • Paid YTD 2008-09: $ 2,373 • Paid YTD 2007-08: $22,567 26
Responsible: Manager Corporate Services • Potential Professional Indemnity Claims • This shows the total potential professional indemnity claims (possible breach of duty) compared to the previous year. • Claims YTD 2008-09: 0 • Claims YTD 2007-08: 0 Responsible: Manager Corporate Services • Payments for Professional Indemnity Claims • This shows the total amount paid by council each month for professional indemnity claims (possible breach of duty). Council pays up to a maximum of $10,000 per claim • Paid YTD 2008-09: $ 0 Paid YTD 2007-08: $ 0 27
Responsible: Manager Works & Hydraulics • Total Average Daily Water Consumption (Normal Consumers) • The average daily water consumption by month is the total amount of water used by the city (normal consumers) each month divided by the number of billing days in that period, compared to the last two years. • Actual May 09: 15.73 Mega-litres/day • Estimate May 09: 20.10 Mega-litres/day Under 4.37 Mega-litres/day • Total Monthly Rainfall (from Tolosa Park Daily Readings) - May 2009: 56.80 mm - May 2008: 16.40 mm Over: 40.40 mm 28
Responsible: Manager Works & Hydraulics • Total Cumulative Consumption of Water (Normal Consumers) • The cumulative, year to date consumption for water compared to the water budget and the last 2 years consumption. • Actual YTD: 7,454 Mega-litres • Estimate YTD: 7,827 Mega-litres Under Estimate: 373 Mega-litres Responsible: Manager Works & Hydraulics • Total Cumulative Cost of Water (Normal Consumers) • The cumulative, year to date cost for water compared to the water budget and the last 2 years expenditure. • Actual YTD $5,093,417 • Estimate YTD $5,186,558 Under Estimate $ 93,141 29
Responsible: Manager Works & Hydraulics • Total Cumulative Consumption of Water (Major Excess Consumers) • The cumulative, year to date consumption of water (Major Excess Consumers) compared to the water budget and the last 2 years consumption. • Actual YTD 2,650 Mega-litres • Estimate YTD 2,722 Mega-litres Under Estimate 72 Mega-litres Responsible: Manager Works & Hydraulics • All Excess Water Consumers Revenue • The revenue from All Excess Water Consumers is based on their usage. • Actual YTD $2,483,950 • Estimate YTD $2,532,922 Under Estimate $ 48,972 30
Appendix A Responsible: Manager Community Development • Family Day Care Operating Revenue • The total operating revenue earned by Family Day Care in comparison to the budgeted Revenue • Actual YTD: $294,967 • Budget YTD: $285,293 Over Budget $ 9,674 Responsible: Manager Community Development • Family Day Care Operating Expenditure • The total operating expenditure of Family Day Care in comparison to the budgeted expenditure. • Actual YTD: $302,483 • Budget YTD: $325,189 Under Budget $ 22,706 31
Responsible: Manager Community Development • Berriedale Child Care Centre Operating Revenue • The total operating revenue earned by Berriedale Child Care Centre in comparison to the budgeted Revenue • Actual YTD: $568,186 • Budget YTD: $604,067 Under Budget $ 35,881 Responsible: Manager Community Development • Berriedale Child Care Centre Operating Expenditure • The total operating expenditure of Berriedale Child Care Centre in comparison to the budgeted expenditure. • Actual YTD: $645,326 • Budget YTD: $650,820 Under Budget $ 5,494 32
Responsible: Manager Community Development • Benjafield Child Care Centre Revenue • The total operating revenue earned by Benjafield Child Care Centre in comparison to the budgeted Revenue • Actual YTD: $476,343 • Budget YTD: $521,678 Under Budget $ 45,335 Responsible: Manager Community Development • Benjafield Child Care Centre Expenditure • The total operating expenditure of Benjafield Child Care Centre in comparison to the budgeted expenditure. • Actual YTD: $545,575 • Budget YTD: $579,234 Under Budget $ 33,659 33
Responsible: Manager CommunityDevelopment • Clydesdale Child Care Centre Revenue • The total operating revenue earned by Clydesdale Child Care Centre in comparison to the budgeted Revenue • Actual YTD: $389,033 • Budget YTD: $405,364 • Under Budget $ 16,331 Responsible: Manager Community Development • Clydesdale Child Care Centre Expenditure • The total operating expenditure of Clydesdale Child Care Centre in comparison to the budgeted expenditure. • Actual YTD: $421,238 • Budget YTD: $389,776 • Over Budget $ 31,462 34
Responsible: Manager Community Development • Claremont Outside School Hours Care Revenue • The total operating revenue earned by Claremont Outside School Hours Care in comparison to the budgeted Revenue • Actual YTD: $105,217 • Budget YTD: $108,502 • Under Budget $ 3,285 Responsible: Manager Community Development • Claremont Outside School Hours Care Expenditure • The total operating expenditure of Claremont Outside School Hours Care in comparison to the budgeted expenditure. • Actual YTD: $110,201 • Budget YTD: $126,213 Under Budget $ 16,012 35