Download
1 / 34
340 likes | 528 Views
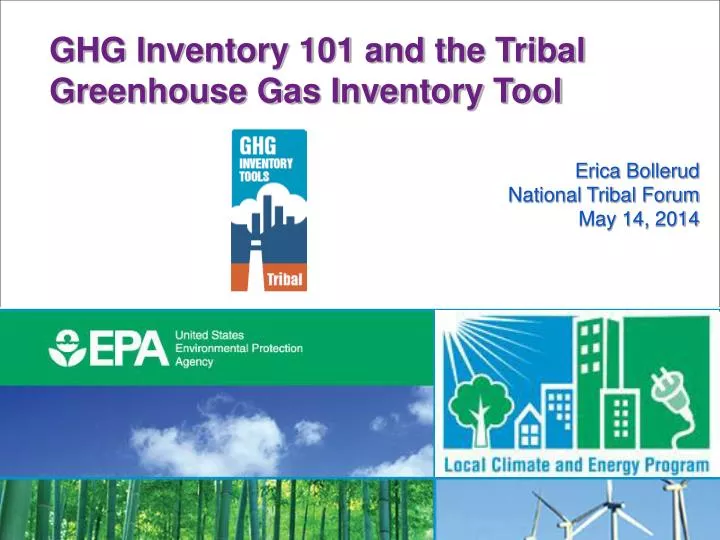
GHG Inventory 101 and the Tribal Greenhouse Gas Inventory Tool Erica Bollerud National Tribal Forum May 14, 2014. Inventory 101 Overview. Background on EPA’s State and Local Climate and Energy Program Topics to Consider when Initiating an Inventory

E N D
GHG Inventory 101 and the Tribal Greenhouse Gas Inventory Tool Erica Bollerud National Tribal Forum May 14, 2014
Inventory 101 Overview • Background on EPA’s State and Local Climate and Energy Program • Topics to Consider when Initiating an Inventory • Putting Your Inventory into Context • Tribal GHG Inventory Tool Inventory 101
EPA’s State and Local Climate and Energy Program Helping state, local & tribal governments reduce greenhouse gas emissions. • We use co-benefits strategies to achieve GHG and policy goals • Environmental, energy, economic, health benefits • Example: EE/RE/CHP can lower costs to comply with air standards • We foster inter-agency collaboration • States – air offices, energy offices, PUCs • Locals – planning, environmental services, energy and others • Tribes – provide tools, help connect with federal program resources • We help state, local and tribal governments make the case for action • Best practice-based policy approaches • Analytical tools and information • We support adaptation efforts for holistic climate action http://www.epa.gov/statelocalclimate
Resources for Local and Tribal Governments • Climate Showcase Communities • 50 models of local/tribal climate change action • Case studies, templates, and other resources to support replication • www.epa.gov/climateshowcase • Key Guidance and Tools • Comprehensive Local Climate and Energy Website • www.epa.gov/statelocalclimate • Local Government Climate and Energy Strategy Series on EE, RE, transportation, waste management, and community design topics • www.epa.gov/statelocalclimate/web-podcasts/local-webcasts.html • Newsletter updates on funding, tools, and events • www.epa.gov/statelocalclimate/web-podcasts/local-webcasts.html • Access to other federal technical support programs • Peer Exchanges • Webcast Series on mitigation and adaptation topics • http://www.epa.gov/statelocalclimate/web-podcasts/index.html
Tribal CSC Projects • Tanana Chiefs Conference, Fort Yukon, AK • Local Food Production/Combined Heat and Power • Gila River Indian Community, AZ • Solid waste recycling program and GHG Inventory • Santa Ynez Band of Chumash Indians, CA • Solar installations and job training • Northern Cheyenne Tribe, MT • Energy retrofit of community building • Choctaw Nation of Oklahoma • Lighting retrofits in community health facilities • Confederated Tribes of Siletz Indians • Solar PV installations on community buildings and tracking of energy in tribal buildings
Purpose of inventory Setting boundaries Direct and Indirect Emissions Quantification approach Setting a baseline Timelines and level of effort Engaging stakeholders Topics to Consider
To identify the greatest sources of GHG emissions within your geographic region To understand emission trends To quantify the benefits of specific activities that result in GHG emissions To provide a basis for developing an action plan To track progress at reducing emissions To set goals and targets for future reductions Why prepare an inventory?
Boundaries: Physical or Organizational? • Physical: emissions within a certain geographic region • e.g., the state of California • Organizational: emissions within a certain entity’s control • e.g., municipal operations in King County • Project: emissions/reductions associated with a particular project • e.g., ghg reductions from installing methane capture technology at a municipal landfill
What Quantification Approach to Use? • Top-down • Uses Aggregated Data (often compiled by govt agencies) to provide a big-picture view of total emissions • Bottom-up • Uses more detailed data (often representing end use information) to provide more detailed but often less inclusive picture.
Tribal Government Building Energy Use Examples of Quantification Approaches • Top-down • Acquire total energy consumption data from utility or calculate based on energy expenditures to generate total emissions from local government fossil fuel use • Bottom-up • Track each building’s fossil fuel consumption individually and calculate resultant emissions
Pros and Cons of Quantification Approaches • Top-down Advantages • Quick, efficient, and comprehensive estimates • Good for tracking large trends over time • Keeps data manageable for large sectors • Errors tend to average out across sector • Top-down Disadvantages • Lose ability to compare different facilities/buildings/industries • Aggregated data isn’t always available or credible—especially at the sub-state level
Pros and Cons of Quantification Approaches • Bottom-up Advantages • More detailed analysis is possible • May better identify targets for mitigation planning • Can be used when high-level data is unavailable • Bottom-up Disadvantages • Requires more data—more time consuming to collect and manage • Detailed data isn’t always complete or consistent
How do I Choose a Baseline Year? • Think it through! • How will baseline data be used? • Are there anomalies present in the baseline (uncharacteristically high or low emissions)? • How will regulatory or voluntary efforts proposed or in progress affect baseline and/or future emissions? • Will the baseline be compatible with baselines being used elsewhere? • Is the data available? Choose a baseline that is realistic and meets your specific needs
It All Comes Down to Data • Availability • 1990 data can be difficult to obtain • Quality • Bottom-up v. top-down • How is it collected? • Is it verified? Is it credible? • Scale • Entity-level, community-level, national-level
How Long Does an Inventory Take? • Timeline dependent on: • Data availability and vintage • Reporting requirements • Reduction commitments • Level of effort dependent on: • Resources (human, and economic) • Data availability and access • Level of detail (number of gases, number of sources, level of disaggregation) • Top-down vs bottom-up • Keep the 80/20 rule in mind
What is the 80/20 rule? • Focus efforts on the “most important” sources • Sometimes only 20% of the effort is needed to quantify 80% of emissions • Focus on: • Energy use: Stationary and Transportation • 92%+ of emissions Delaware Valley Regional Planning Commission GHG Inventory
Why Engage Stakeholders? • How can they contribute? • Data, resources, outreach, public support • Who to Engage? • NGOs • Community groups • Schools and Universities • Other Government Agencies
Putting Inventory Results in Context • Comparison to other inventories (many are online) • State summaries available on EPA website • Representative examples of local inventories on EPA website • Climate Analysis Indicator Tool (CAIT) • Make sure to compare equivalent numbers • Order of magnitude checks • Use of Indicators • Per capita or per household • Per unity of economic activity
Background and Goals Respond to requests for assistance with measuring GHG emissions Help tribal governments across the US to evaluate GHGs associated with both government operations and community-wide activity Support development of baselines for tracking emission trends, developing mitigation strategies and policies, and assessing progress towards meeting goals Provide a free, easy-to-use tool consistent with accepted protocols and methodologies
Tribal GHG Inventory Tool Basics • Excel based (Excel 2007 or later) • Divided into 2 modules, can be used independently • Government Operations Module • Community-Wide Module • Designed be flexible to the needs and constraints of different tribes • data can be entered at any scale, ranging from tribe-wide activity data to data by facility or meter • default emissions factors are provided, but can be over-written with location-specific factors • customize year of inventory, number of departments, etc
Government Operations • Based on the Climate Registry’s Local Government Operations Protocol, version 1.1. • Covers ten sectors of municipal emissions: • Stationary Fossil Fuel Combustion • Mobile Fossil Fuel Combustion Scope 1 • Solid Waste Management • Wastewater Treatment • Electricity Consumption Scope 2 • Employee Commute • Agriculture & Land Management • Urban Forestry Scope 3 • Waste Generation (offsite disposal) • Water Use (offsite supply/treatment) • Additional Sources
What are Direct and Indirect Emissions? • Direct Emissions (aka scope 1) • Emissions that are released from activities within the inventory boundary • Fossil fuel combustion • Fertilizer application • Landfill operation • Indirect Emissions (aka scope 2 and 3) • Emissions that occur outside the boundary because of activity or demand within the boundary • Purchased electricity • Off-site waste disposal • Lifecycle related emissions
What are Scopes? Source: WRI/WBCSD GHG Protocol Corporate Standard, Chapter 4 (2004).
Government Operations Structure • Table of Contents page • main navigational portal • track completion of each data source • Inventory Control Sheet • enter name of tribe and year of inventory • set up and define departments • Set up electricity provider information • Entry Sheet/Data Sheet • enter/review descriptions and consumption activity by unit • some sectors allow batch import of data • Summary/Calculation Sheets • show calculations/equations and summary data • No data entry required, informational only • Inventory Summary Page • compiles all entered data • tables and charts of emissions data
Government Operations: Navigation Page Click anywhere in the Table of Contents to jump to a section of the tool
Community Module • Based on ICLEI’s Global Protocol for Community-Scale GHG Emissions, version 0.9 • Covers nine sectors of community-scale emissions: • Stationary Fossil Fuel Combustion • Mobile Fossil Fuel Combustion Scope 1 • Solid Waste Management • Wastewater Treatment • Electricity Consumption Scope 2 • Agriculture & Land Management • Forestry Scope 3 • Waste Generation (offsite disposal) • Water Use (offsite supply/treatment) • Additional Sources Varies
Tool Structure • Table of Contents page • main navigational portal • track completion of each data source • Inventory Control Sheet • enter name of city and year of inventory • set up electricity provider information • Entry Sheet/Data Sheet • enter/review descriptions and consumption activity by unit • some sectors allow batch import of data • Summary/Calculation Sheets • show calculations/equations and summary data • No data entry required, informational only • Inventory Summary Page • compiles all entered data • tables and charts of emissions data
Community Module: Navigation Page Click anywhere in the Table of Contents to jump to a section of the tool
Community Module: Inventory Control Sheet Enter City Name and Inventory Year Select eGRID subregion or enter utility factors “Set Up” Inventory
Community Module: Data Entry Page Navigation/Tracking Buttons Add/Edit/Delete entries Enter description and consumption data
Community Module: Navigation Page Revisited Table of Contents boxes change color as you mark sheets complete
Community Module:Summary Page Charts and Tables of: Total Emissions Emissions by Source & Sector
Additional resources • Portfolio Manager • http://www.energystar.gov/benchmark • Emissions & Generation Resource Integrated Database (eGRID) • http://www.epa.gov/egrid • Power Profiler • http://www.epa.gov/powerprofiler • Climate CHange Emissions Calculator Kit (Climate CHECK) • http://www.epa.gov/climatechange/wycd/school.html • Waste Management Related Tools • http://www.epa.gov/climatechange/wycd/waste/tools.html • http://www.epa.gov/lmop/res/index.htm#5 • Transportation Related Tools • http://www.epa.gov/otaq/stateresources/tools.htm • http://www.epa.gov/greenvehicles
For more information: Erica Bollerud State and Local Climate and Energy Program U.S. EPA 1200 Pennsylvania Avenue (6202 J) Washington, DC 20460 Phone (202) 343-9282 bollerud.erica@epa.gov