Download
1 / 28
280 likes | 578 Views
Anthony Bridges, Deputy Executive Officer, FCMAT Andrew Prestage, Management Analyst, FCMAT Ajit Mandal, Software Developer, Proxient Technologies. Fiscal Projections: A Good Idea? District Fiscal Problems due to: Declining Enrollment Salary Compensation Health & Welfare Benefits

E N D
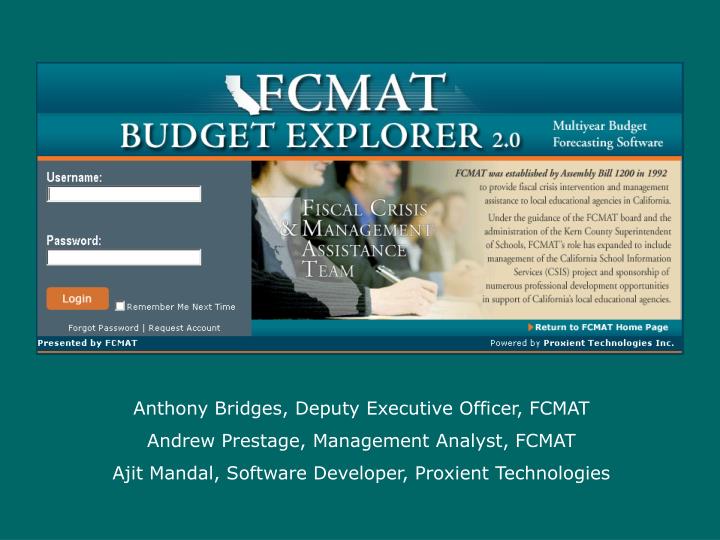
Anthony Bridges, Deputy Executive Officer, FCMAT Andrew Prestage, Management Analyst, FCMAT Ajit Mandal, Software Developer, Proxient Technologies
Fiscal Projections: A Good Idea? • District Fiscal Problems due to: • Declining Enrollment • Salary Compensation • Health & Welfare Benefits • Changes in State Economy
FCMAT recommendation: Delay decisions regarding Collective Bargaining or significant ongoing expenditures until after 1/15/08; The Governor will soon declare a fiscal emergency; Mid-year cuts will be a reality; State of the State message delivered 1/8/08; The Preliminary State Budget will be released on January 10th.
FCMAT recommendation: Regarding multi-year forecasting, the focus has to be on the current plus one additional year only. The state’s fiscal situation is too volatile and unstable to project further. Until housing, energy, construction and unemployment begin to move in a more positive direction, the state’s revenue position and cash will remain unstable which will affect Proposition 98.
FCMAT recommendation: In the creation of a multi-year forecast using BE, create a projection using the 4.3% COLA (sourced from the SSC Projection Dartboard), and another reflecting a 0% COLA. Produces “what if?” analysis of alternative scenarios.
Historical Perspective: • SACS Software • Spreadsheets (Lotus 1-2-3, Excel) • MYP by
BEv2 System Requirements: • Browser: Internet Explorer • Platform: PC-Based • Screen Resolution: 1,280 x 1,024¹ ¹ This is a minimum resolution setting. Use of higher resolution settings is acceptable.
www.budgetexplorer.org Logging In
www.budgetexplorer.org Logging In
Creating a New Projection: • Projections are created by uploading SACS data obtained: • from your financial system, or; • from the state’s Financial Reporting (SACS) software. RL supplemental form data is uploaded as well (if it has been entered), thereby reducing data input.
Step 1: To import a new data file, use this radio button. To use a previously imported data file, use this radio button. Your list of available data files will grow over time, and older files will need to be removed. Use the button to remove data files that are no longer of value.
Step 2: Step 2a: Use these options to specify the data to use as your “Base Year”. The checkbox can be used to also upload “Historical” data. Historical data adds perspective by allowing visual comparison of Base Year datawith prior year Estimated Actuals. Step 2b: Use this dropdown field to specify the “Base Year”.
Select which fund to project forward using this dropdown field. Step 3: Select how many years to project forward (2, 3, 4 or 5)
Home Screen The Button Bar provides access to frequently used screens. The Navigation Tree provides access to frequently used screens.
Fully Integrated System… ENR ADA Staff Salary Forecaster Projection Variables RL $ Salaries & Benefits Other Revs, Exp’s. Ending Fund Balance
Go Back Add Object Save Export to Excel Export to PDF Graphs Help Small Font Medium Font Large Font Home Screen This toolbar offers: Change the forecasting period or projection description.
Upload your SACS Data Check your Projection Rules Check your Enrollment & ADA Review the Salary Forecaster Check the RL Calculation Balance the Restricted Resources Print Reports A Five Minute Process… Steps:
Values for these rules are obtained from the SSC Projection Dartboard. Updates are made each time a new Dartboard is released. Projection Rules
How Rules Work Consumer Price Index (CPI) rule settings: Base Year Rule ProjYr1 ProjYr2 Object Description 2006-07 Name 2007-08 2008-09 4100 Texts/Materials 100,000 CPI 103,000 105,575 BE applies the 3% increase to the Base Year and places the result in the 1st projected year. BE applies the 2.5% increase to ProjYr1 and places the result in the 2nd projected year. BE looks up the value of the Projection Rule that has been applied for ProjYr2. BE looks up the value of the Projection Rule that has been applied for ProjYr1.
The Enr/ADA/Staffing area is divided into 2 screens: Enrollment & ADA 5 years of state-reported CBEDS data is loaded automatically. Enrollment is projected based on the Weighted Moving Cohort Progression model.
The ability to “share” projections • Separates BEv2 as an information sharing, planning, and collaboration resource; • Can be “R/O” or; • Can be “R/W”. Sharing a Projection
County Office District Office Sharing a Projection COE creates projection(s) for each district using SACS data and shares the projection(s) with district personnel for review and comment. District creates projection(s) and when ready, shares the projection(s) with COE personnel for review and comment.