Download
1 / 15
150 likes | 342 Views
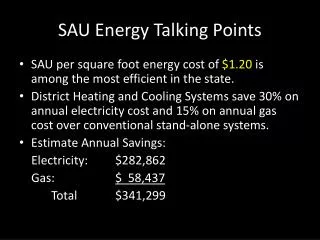
SAU Energy Talking Points. SAU per square foot energy cost of $1.20 is among the most efficient in the state. District Heating and Cooling Systems save 30% on annual electricity cost and 15% on annual gas cost over conventional stand-alone systems. Estimate Annual Savings:

E N D
SAU Energy Talking Points • SAU per square foot energy cost of $1.20 is among the most efficient in the state. • District Heating and Cooling Systems save 30% on annual electricity cost and 15% on annual gas cost over conventional stand-alone systems. • Estimate Annual Savings: Electricity: $282,862 Gas: $ 58,437 Total $341,299
SAU Energy Talking Points • Selecting energy efficient equipment has resulted in approximately $100,000 in rebates from power and gas companies over the past 5 years. • $2.5M AARA funding and $1.6M RLF funding spent on energy efficiencies over past 4 years. In the 2010/2011 FY, SAU experienced a 21% reduction in KWH, and 11% reduction in demand charges and a cost reduction of 35%. However, record heat waves, 14% increase in new construction square footage, a 115% increase in water unit cost , 47% increase in wastewater unit cost and a 7.9% increase in student enrollment and associated OPTEMPO have offset some of these savings.
SAU Energy Talking Points • Reference following 5 year history of energy usage and cost charts: • Factors Influencing Usage & Cost • Square footage increased by 14%. • Student population increased by 7.9% • Student activity and OPTEMPO increased proportionally. • Water unit price increased by 115% • Wastewater unit price increased by 47% • Experienced hottest summer months on record during 2009-2012 period.
SAU Energy Talking Points • Performance Indicators (Based on 5 Year Average) • Overall utility cost increased by only 6% ($1.20 per square foot). • Electrical usage increased by 4.6%; cost increased by 0.4%. (Electricity is 60% of overall cost). • Gas usage increased by 15%; cost decreased by 14% due to significant reduction in unit market cost. (Gas is 21% of overall cost. • Water usage increased by 22%; cost increased by 102% due to 115% increase in unit price and increased usage (Water is 11% of overall cost). • Wastewater usage increased by 135%; cost increased by 96% due to 47% increase in unit price and increased usage. Wastewater is 8% of overall cost.
$3.06/K gal. Switched to City Water Tower May 2010. $1.43/K gal.
$2.75/K gal. $1.87/K gal.