Download
1 / 84
870 likes | 1.11k Views
Explore epidemiology from a historical perspective to current clinical trials, emphasizing Hill's Criteria for establishing causal connections in disease studies. Analyze risk factors, study designs, and evidence coherence.

E N D
Epidemiology, Clinical Trials & Biostatistics National Lipid Association 2009 Master’s Course in Lipidology Kevin C. Maki, Ph.D. Provident Clinical Research Glen Ellyn, IL Diplomate, Accreditation Council for Clinical Lipidology
Epidemiology • The study of the distributions and determinants of diseases in human populations • Most epidemiologic investigations are observational, therefore cannot directly demonstrate causal relationships • Results useful for generating hypotheses about possible causal relationships
Risk Factors and Risk Markers • A risk factor or risk marker is a variable associated with risk for a disease • Risk factors are correlational and not necessarily causal
Hill’s Criteria of Causation • Established by A.B. Hill as a way to assess the link between smoking and lung cancer • Criteria to establish scientifically valid causal connections between a potential causal agent and a disease
Hill’s Criteria of Causation • Temporal Relationship • Exposure precedes the outcome • Strength of Association • Stronger associations more likely to be causal • Dose-Response Relationship • Greater exposure produces greater risk • Consistency • Results are replicated in multiple studies and populations
Hill’s Criteria of Causation • Biologic Plausibility • There is a plausible mechanism to account for the finding • Alternative Explanations • Other hypotheses have been excluded • Experiment • Supported by data from clinical trials or, if not practical, animal studies
Hill’s Criteria of Causation • Specificity • A single cause produced a specific effect • Not essential, e.g., smoking is a risk factor for both CHD and lung cancer • Coherence with existing evidence • Supported by evidence from other types of investigation (animal, laboratory, etc.) • Judgments about causality must consider the totality of the evidence
Epidemiology: Historical Perspective • Epidemiological methods were originally employed in the study of infectious disease outbreaks or “epidemics” • In 2nd half of the 20th century, epidemiological methods were extended to the study of chronic diseases, particularly atherosclerotic cardiovascular diseases, especially CHD • Populations with high CHD mortality rates had more fatty streaks and atherosclerotic lesions in their coronary arteries at autopsy Keys. Nutrition 1970; 13:250-252.
CVD Epidemiology: Historical Perspective • The Seven Countries Study showed that CHD mortality varied by as much as 10-fold between countries • Average blood cholesterol levels were associated with CHD mortality • Dietary saturated fat and cholesterol intakes were closely associated with blood cholesterol levels • Helped establish the “Diet-Heart Hypothesis” Steinberg. J Lipid Res 2005;46:179-190. Robertson et al. Am J Cardiol 1977;39:239-243
The Framingham Heart Study • Initiated in 1948, one of the earliest large-scale investigations in cardiovascular epidemiology • Prevailing view was that CHD was an unavoidable consequence of aging • Measured many attributes of ~5,000 residents in Framingham, MA • Subjects were followed over decades to assess characteristics associated with the development of CHD • Provided evidence that variation in CHD rates within a population could be predicted by several “risk factors” www.epi.umn.edu/cvdepi
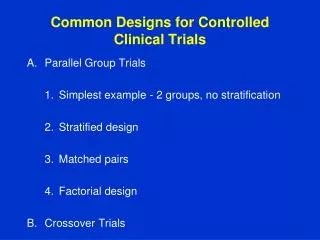
Study Designs in Epidemiology • Descriptive • Case-control • Cohort • Intervention
Descriptive Studies • Case reports and case series • A single patient or group of patients with a similar diagnosis • Cross sectional studies (surveys) • Exposure and disease status assessed simultaneously • Provides a “snapshot” of a population • Unit of study may be individuals or groups • Example – blood cholesterol and CHD mortality in the Seven Countries Study
Seven Countries Study – 1950s Brown & Goldstein Science 2006;311:1721-1723.
Changes in Free Fructose Intake and Prevalence of Overweight in the US Bray GA.AJCN 2004;79:537-543
Relationship Between Serum 25-OH Vitamin D and HDL Cholesterol Maki et al. presented at NLA Annual Meeting, April 2009
Case-Control Studies • Subjects selected based presence or absence of a particular disease • Cases versus controls • Groups compared based on a previous exposure (hypothesized risk factor) • Allows for the study of diseases with long latency and/or low incidence • Allows evaluation of multiple exposures and their relationships to the disease
INTERHEART: A Case Control Study • A case-control study of acute myocardial infarction (MI) in 52 countries • 15,152 cases and 14,820 controls enrolled • Evaluated the relationships between major risk factors identified in earlier epidemiologic investigations and MI • Nine potentially modifiable risk factors “accounted for” more than 90% of the variation in acute myocardial infarction among men and women Yusef et al. Lancet 2004;364:937-52
INTERHEART: Risk of Acute MI Associated With Modifiable Risk Factors Yusef et al. Lancet 2004;364:937-52
INTERHEART: Odds Ratio for MI According to ApoB/ApoA1 Ratio Yusef et al. Lancet 2004;364:937-52
Lifestyle-Heart Hypothesis Mozaffarian et al. Circulation 2008;117;3031-3038
Cohort Studies • Subjects free of disease are followed to document disease incidence • Groups defined on the basis of exposure or lack of exposure to a suspected risk factor(s) • Allows for the examination of a single exposure for multiple outcomes • US Nurses’ Health Study • Typically requires large numbers of subjects followed over many years to accumulate events
Types of Observational Cohort Studies • Retrospective cohort studies • Exposure and outcomes of interest have already occurred before study initiation • Examples - managed care and employment physical studies (subjects followed forward in time, but to points in the past) • Prospective cohort studies • Exposures may or may not have occurred at the time of study initiation (e.g., FHS) • Outcomes have not occurred at study initiation
PROCAM Study • Prospective Cardiovascular Münster Study • Initiated in 1979 • 4,849 men followed over time to record incidence of CHD • Fasting triglycerides were an independent risk factor for CHD events, adding predictive information to LDL-C and LDL-C levels Assmann et al. Eur Heart J. 1998;19(suppl M):M8-M14.
PROCAM: Triglycerides Amplify the Effects of Other Risk Factors Triglycerides < 200 mg/dL Triglycerides > 200 mg/dL 250 200 150 CAD Cases/1000 in 6 years 100 50 0 <5.0 5.0+ LDL-C/HDL-C Assmann et al. Eur Heart J. 1998;19(suppl M):M8-M14.
Nurses’ Health Study • Prospective cohort study • Established by Dr. Frank Speizer in 1976 to investigate the long term consequences of oral contraceptive use • Approximately 123,000 nurses • Biannual questionnaires about diseases and health-related topics • Food frequency questionnaire initiated in 1980 • Many outcomes studied • CVD, diabetes, cancers http://www.channing.harvard.edu/nhs/
Nurses’ Health Study: CHD Incidence, BMI and Waist Circumference Rexrode et al. JAMA. 1998;280:1843-1848.
Clinical Intervention Studies • The randomized, controlled trial is the “gold standard” for evaluation of medical interventions • Exposure is assigned • Least susceptible to known and unknown sources of bias and confounding • Validity and generalizability rely on: • Appropriate selection of study participants • Random subject assignment to treatments • Blinding and use of a placebo or sham intervention where practical
Issues Affecting the Validity and Generalizability of Clinical Trials • Results must be valid to be generalizable • Valid results are not always generalizable • Factors that can adversely affect validity • Poor subject compliance • Excessive or differential dropout • Incomplete blinding • Changes in treatment during the trial that confound the study results (e.g., MR-FIT, FIELD)
Validity in Clinical Trials: Compliance • Subjects must adhere to the treatment regimen for results to be valid • Excessively complex trials may create undue subject burden and reduce compliance • Side effects may limit compliance and bias toward the null • Lipid Research Clinics Coronary Primary Prevention Trial (LRC-CPPT) • Cholestyramine vs. placebo • Protective effect of the drug was stronger in those with higher compliance
Validity in Clinical Trials: Dropout • May occur when treatment has unpleasant side effects or is difficult • Weight loss trials • Smoking cessation trials • Differential dropout • With active treatment due to side effects (e.g., niacin) • In control treatment due to lack of benefits
Validity in Clinical Trials: Blinding • If a drug has side effects subjects will know they are on active treatment • Example: flushing from niacin treatment • Non-efficacious quantity of niacin was added to placebo so that subjects would experience mild flushing • Example: altered menstrual cycle on hormonal therapy (HERS) • Separate evaluators to assess gynecological and non-gynecological issues
Validity in Clinical Trials: Changes to Treatment • Multiple Risk Factor Intervention Trial (MR-FIT) • Standard care changed over 6-8 yr follow-up • Narrowed the differences between the treatment arms in levels of several risk factors • Trial failed to show a significant benefit for CHD or total mortality MR-FIT Investigators. JAMA 1982;248:1465-1477.
Interpretation of Study Results • Three main factors should be assessed during the interpretation of study results: • Chance • Was this a random chance finding? • Bias • Was there a non-random error that resulted in an incorrect estimate of the effect of the exposure? • Confounding • Is it possible that an observed association between a exposure and the response was due to the effects of differences other than the exposure under study?
Example of Possible Bias in a Clinical Trial • The Incremental Decrease in End Points through Aggressive Lipid Lowering (IDEAL) Study • Prospective, randomized, open-label, blinded end-point evaluation trial (PROBE design) • Subjects with a history of MI (n = 8888) were assigned to standard-dose simvastatin (20 mg) or high-dose atorvastatin (80 mg) and followed for an average of 4.8 y • Compliance was higher (95% vs. 89%) and dropout was lower (7% vs. 14%) in the simvastatin group • Mean on-trial levels of LDL-C were 81 and 104 mg/dL in the atorvastatin and simvastatin groups, respectively: a smaller difference than projected Pedersen et al. JAMA 2005;294:2437-2445
Example of Possible Bias in a Clinical Trial Pedersen et al. JAMA 2005;294:2437-2445
FIELD Trial: Example of Confounding in a Clinical Trial • Subjects with Type 2 diabetes (N = 9795) • Randomly assigned to receive • Fenofibrate 200 mg/d • Placebo • Average follow-up : ~5 years • During the study more subjects in the placebo group started other lipid drug therapy (17% vs. 8%) FIELD Investigators. Lancet 2005;366:1849-1861.
FIELD Trial: Example of Confounding in a Clinical Trial FIELD Investigators. Lancet 2005;366:1849-1861.
FIELD Trial: Effects of Fenofibrate on CVD Events FIELD Investigators. Lancet 2005;366:1849-1861.
FIELD Trial: Effects of Fenofibrate on CVD Events • Treatment effect • HR = 0.89, 95% CI = 0.75 to 1.05, P = 0.16 • The hazard for an event in the fenofibrate group was 89% of that in the placebo group • Reduced by 11% • Because the 95% confidence interval crosses 1.0, difference was not statistically significant at the 5% level • As confirmed by the P-value FIELD Investigators. Lancet 2005;366:1849-1861.
Efficacy vs. Effectiveness in Clinical Trials • Efficacy • Refers to whether an intervention produces the desired effects when properly implemented under controlled conditions • Effectiveness • Refers to whether an intervention is typically successful in clinical practice • In order for a treatment to be useful, it must be both efficacious and effective
Evaluation of Clinical Trial Results • Intent-To-Treat Analysis • All subjects randomized are analyzed (or as close to this ideal as possible) • Subjects are part of their assigned group whether or not they actually received the treatment, adhered to the treatment regimen, or even received the opposite treatment • Per Protocol Analysis • Subjects who discontinued or who had material protocol violations, including poor adherence, are excluded from the analysis
Evaluating a Published Clinical Trial Report • Was the subject sample similar to patients commonly seen in clinical practice? • If not, will this limit generalizability? • Were important subgroups represented? • Both sexes, smokers, those with obesity and/or diabetes, various lipid phenotypes • Were random allocation, concurrent controls and blinding all employed?
Evaluating a Published Clinical Trial Report • Were subjects generally compliant with the treatment regimen? • Compliance consistent between treatments? • Did the trial suffer from excessive subject attrition or differential dropout between treatments? • Was the primary outcome variable pre-specified and clearly stated? • Did the trial show a statistically significant difference for the primary outcome variable?
Evaluating a Published Clinical Trial Report • Did the results appear consistent across subgroups and secondary analyses? • If significant results were not achieved, could this have been due to the trial lacking sufficient statistical power to detect a clinically meaningful difference? • How do the results from this trial align with those from other sources? • Clinical trials, observational studies, animal experiments and mechanistic investigations
Descriptive Statistics • Central tendency • Mean (arithmetic average) • Median (50% above and below) • Dispersion • Standard deviation • Range limits (minimum and maximum) • Inter-quartile range limits (25th, 75th percentiles) • Precision of a point estimate for a mean • Standard error of the mean (equal to SD/√n) • 95% confidence interval (mean ± 1.96*SEM)
Normal Curve Mean ±1 SD ~68% , ±2 SD ~95%, ±3 SD 99.7%
Inferential Statistics for Means • Two groups • t-test • More than 2 groups • Analysis of variance (ANOVA) followed by a post-hoc test such as the Tukey procedure • Tests using ranks in place of raw data are used when the sample is small or when the distribution is not normal (e.g., skewed) • Non-parametric tests
Statistical Power and Sample Size • Type I statistical error • Finding “significance” when a relationship is due to random variation (false positive) • Type II statistical error • Failing to find significance when it is truly present • Insufficient power (false negative) • Statistical power • Likelihood of finding significance if it is truly present • 1 – power = likelihood of a type II error • Power usually set at 80% or 90% for a 2-sided p-value of 0.05 for a given set of assumptions when planning a study (10-20% chance of a type II error)
Statistical Power and Sample Size • Ways to increase statistical power • Increase sample size • Increase precision of measurements • Dual x-ray absorptiometry vs. skin-folds for body fat • Average values from multiple days to minimize the influence of biological variation (e.g., hs-CRP, TG, fibrinogen) • LDL-C example: 19%, 10%, 9% SD • Study a higher risk population • A greater number of events will increase power in clinical event studies
Multiple Comparisons, Post-hoc Analyses and Data Mining • With 100 statistical tests, it is expected to find ~5 that are “significant” due to random variation • For clinical studies • Primary and secondary hypotheses should be clearly stated before analysis • Post-hoc and sub-group analyses should be interpreted with caution • Associations uncovered during data mining should be viewed as hypotheses