Download
1 / 31
310 likes | 442 Views
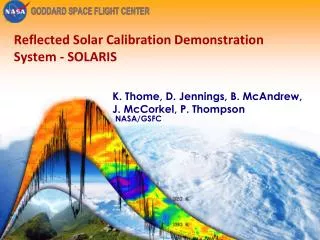
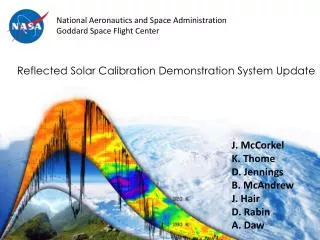
Reflected Solar Radiative Kernel s And Applications. Zhonghai Jin Constantine Loukachine Bruce Wielicki Xu Liu SSAI, Inc. / NASA Langley research Center July 6-9, 2010. Objective:

E N D
Reflected Solar Radiative Kernels And Applications Zhonghai Jin Constantine Loukachine Bruce Wielicki Xu Liu SSAI, Inc. / NASA Langley research Center July 6-9, 2010
Objective: • Introduce the reflected solar spectral kernels, their spectral characteristics, and the potential applications to CLARREO solar benchmark measurement, particularly, • Application to decompose/attribute radiative response to different depenent variables. • Application to solar fingerprinting to evaluate the ability of CLARREO to detect climate changes and feedbacks.
What’s a radiative kernel? Radiative kernels describe the differential response of the top of atmosphere radiation to changes in the feedback variables between two climate states. The radiative kernel approach provides a simple way to separate the total radiative response or interannual variation to different dependent parameters and has been used to study climate feedbacks (e.g., Soden et al., 2008, Sanderson et al., 2009, Huang et al., 2010, …) Only broadband shortwave kernels have been used in current climate studies. Spectral kernels can provide more information. CLARREO will measure reflected solar spectrum with unprecedented accuracy over a wide spectral range globally, that will provide an excellent database for spectral kernel applications in future climate research.
Solar spectral kernel is calculated as: r is the nadir spectral reflectance. is an ensemble of n dependent variables at mean state. is the perturbation of the i-th parameter from the mean state. Ki the kernel for xi. • Why reflectance instead of radiance? • Reflectance change is directly related to the changes of underlying climate variables regardless of solar incidence changes. • Reflectance has much smaller and flatter spectral variation. • Reflectance kernel can be converted to radiance kernel if it is desired.
Parameter variations considered include: Atmospheric properties: PW, AOD, O3. Surface properties: Snow coverage, Seaice concentration, etc.. Cloud properties: τ, fc, h, De, Re. Basic kernels use monthly zonal (10-deg) mean; kernels for larger space/time scales can be derived from basic ones. Mean state here is the average between 2000 and 2005. Monthly average of each parameter in each zone is based on CERES monthly hourly gridded data (SRBAVG), including MODIS cloud/aerosol and GOES atmospheric properties. Once the kernels are calculated, the TOA radiative response is simply (individual response) (total response)
PW Latitude (deg) τice τwat Wavelength (μm) An example of solar spectral reflectance kernel. This example is for the monthly mean reflectance over ocean in April.
Decomposed Interannual Reflectance Variation σ For Various Parameters By Kernels PW fc AOD Latitude (deg) τ O3 Ht Snow Re Compare the decomposed monthly zonal mean reflectance response of different parameters (different panels). (Example for April; 2000-2005 data) Seaice Wavelength (μm)
Atmosphere/Surface Cloud Parameters Total Jan Monthly Global Mean Reflectance Response σ Apr Jul Oct Wavelength (μm) Comparison of monthly global mean reflectance response to different parametervariations.
All areas Ocean Land Comparison of monthly mean reflectance changes from kernel approach (black)andSCIAMACHY observations (red).
An example of using kernels to decompose the measured interannual reflectance change. Ocean only for all months.
Comparison of monthly global mean reflectance anomalies using kernel approach with SCIAMACHY observations over ocean in four months. (ocean Only) RMS
Using Kernels To Test Optimal Detection On Solar Spectra Optimal detection equation: y Reflectance change spectrum K Kernel matrix (fingerprints) a To be retrieved parameter change corresponding to y(anomalies here) e Errors or residuals that cannot be explained by fingerprints Σ Covariance matrix of e
Experiment (a1): Parameters retrieved by optimal detection and comparison with truth. Data for zonal mean in 6 years (2000-2005) (Ocean only). Use local kernels in each 10-deg zone. (An idealized case) Residuals are from spectral shape similarity among different kernels, most importantly, between cloud fraction and optical depth. (a)
Experiment (b1): Same as (a1), but cloud fractions are assumed to be known in optimal detection. Cloud fraction known (b)
Cloud fraction known (a1) (b1)
Cloud fraction known a2 = a1+10% Err in kernel b2 = b1+10% Err in kernel
Cloud fraction known a3 = a1+Sample Err in data b3 = b1+Sample Err in data (a2)
Cloud fraction known a4 a1 + 10% K Err + Data Sample Err B4 b1 + 10% K Err + Data Sample Err (a2)
a. Cloud Fraction Unknown b. Cloud Fraction Known 1. Idealized case 2. Add 10% K Err to case 1 3. Add sampling Err in data 4. Add Errs of 2 + 3 Ice Cloud τ Water Cloud τ Ice Cloud τ Water Cloud τ Comparison of detected and observed zonal mean cloud τ variations in various cases.
Table 1. Summary of RMS Detection Errors In Zonal Mean Parameters *b cases: assumed cloud fraction known. a1, b1: basic idealized case (no error). a2, b2: Case 1 + 10% kernel error. a3, b3: Case 1 + 2-Sat sampling error. a4, b4: Case 1 + Errs of 2+3.
Experiment A1: Global mean parameters retrieved by optimal detection and comparison with truth. Data for 4 months 6 years (2000-2005). Kernels are averaged over global. (Idealized case) (A1)
Experiment B1: Same as A1, but cloud fractions are assumed to be known in optimal detection. Cloud fraction known (B1)
Cloud fraction known (A1) (B1)
A. Cloud Fraction Unknown B. Cloud Fraction Known 1. Idealized case 2. Add 10% K Err to case 1 3. Add sampling Err in data 4. Add Errs of 2 + 3 Ice Cloud τ Water Cloud τ Ice Cloud τ Water Cloud τ Comparison of detected and observed global mean cloud τ variations in various cases.
Conclusion • Solar spectral kernels were produced for different spatial scales (zonal, regional, global). • The kernel approach provides us a simple way to separate/decompose the radiative response to various dependent parameters; therefore, it enables a better understanding of the underlying physical processes responsible for the total radiative response and feedback. • Analysis of interannual variability based on the kernels shows that the cloud amount and optical depth are the two most important factors responsible to the interannual variation of solar reflectance in most spatial and spectral regions. However, snow and sea ice coverage changes could be very important in high latitude land and in polar oceans, respectively. • Large cloud height effect is limited in the absorption bands and particle size effect is mainly in the near infrared spectrum. • The interannual variability of spectral reflectance based on the kernel technique is consistent with satellite observations. The RMS kernel-observation error in monthly global mean reflectance is about 0.001 over ocean, where the sampling error is likely a major component.
The kernels were applied to the optimal detection to evaluate the ability of CLARREO to detect various climate changes and feedbacks. Initial test results indicate that • the retrieval accuracy for cloud τ variation could be improved significantly if the cloud fraction is known, suggesting CLARREO to measure/retrieve the cloud amount directly. • IFCLARREO solar benchmark has small random errors (e.g., sampling error) and IF the right kernels can be found, solar fingerprinting of CLARREO data would work for climate change detection and SW cloud feedback. Future works include Test different techniques to improve/refine the kernels. Apply the optimal detection to IPCC climate change scenarios. Test allowed error limits in data and kernels under CLARREO accuracy requirements for different conditions. Test to include part of IR spectrum if it helps to improve PW detection; but make sure works fine in SW first. ……
Acknowledgement: We thank the Sciamachy science team for the solar radiance data, NASA Langley DAAC for CERES data, and Dr. Sky Yang for SMOBA ozone data.
Fig 6-a. Retrieved global mean parameter changes (PW, AOD and O3). Column 1: consider nonlinearity error only. Column 2: consider fingerprint shape error only. Column 3: consider both 1 and 2. Σnl Σsp Σnl+ Σsp
Fig 6-c. Same as (a), but for cloud height and particle size.