Download
1 / 11
440 likes | 936 Views
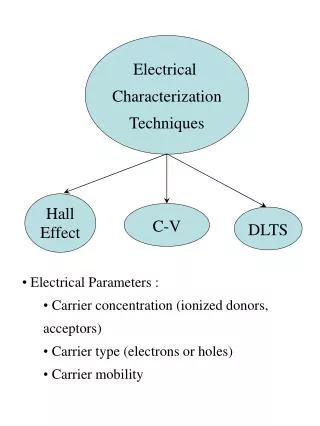
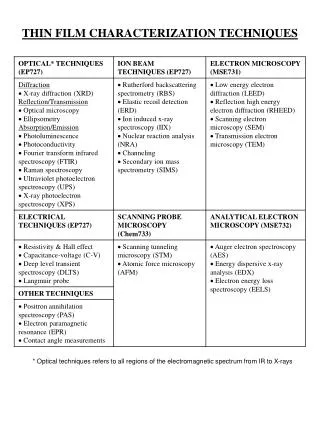
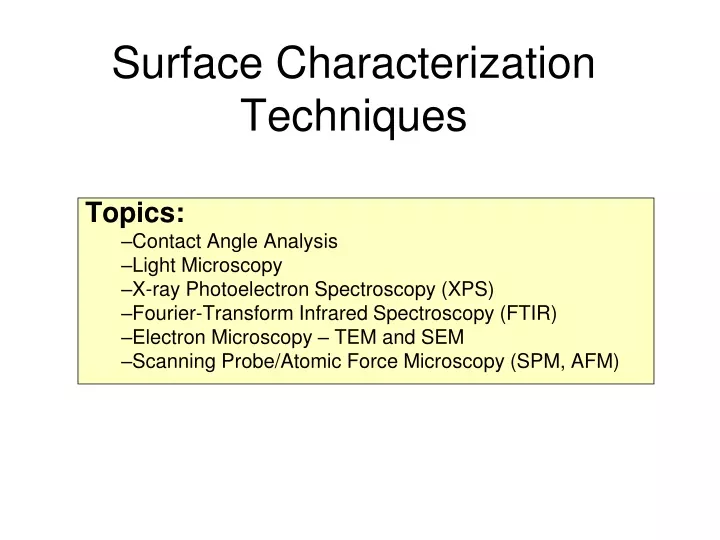
Surface Characterization Techniques. Topics: Contact Angle Analysis Light Microscopy X-ray Photoelectron Spectroscopy (XPS) Fourier-Transform Infrared Spectroscopy (FTIR) Electron Microscopy – TEM and SEM Scanning Probe/Atomic Force Microscopy (SPM, AFM).

E N D
Surface Characterization Techniques Topics: Contact Angle Analysis Light Microscopy X-ray Photoelectron Spectroscopy (XPS) Fourier-Transform Infrared Spectroscopy (FTIR) Electron Microscopy – TEM and SEM Scanning Probe/Atomic Force Microscopy (SPM, AFM)
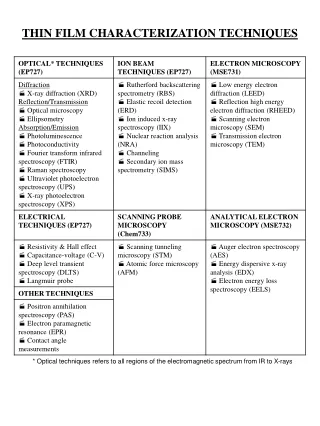
Overview of Characterization Methods Penetration depths can go deeply below the surface.
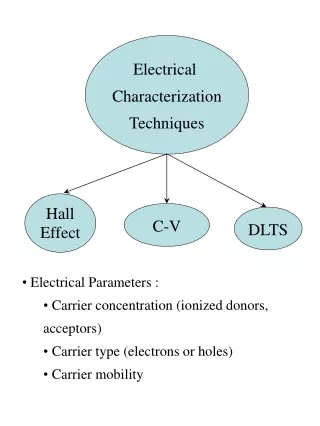
Contact Angle Analysis Contact angle analysis provides information on the hydrophobiciyty of a material. Contact angle is measured using a variety of liquids on a specific material,. The point at which the curve crosses 0 is the critical contact angle, gcand used for the value gSV
Light Microscopy The Compound Microscope Above: Fluorescence can be used to make topographical features more pronounced, e.g., the ridges on the polymer surface. A fibroblast. Light microscopy can be used to view surfaces as small as 0.2 um.
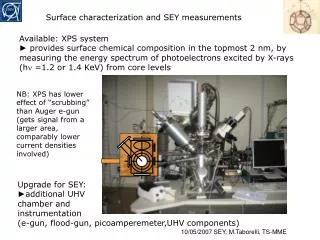
Electron Spectroscopy for Chemical Analysis (ESCA) Left: EXCA spectrum of polydimethyl siloxane (PDMS) Right: Spectrum for triflouroacetate. Binding energy varies with element and type of bond. Left: Electrons emitted as a result of X-ray bombardment are separated by kinetic energy , and counted by the detector.
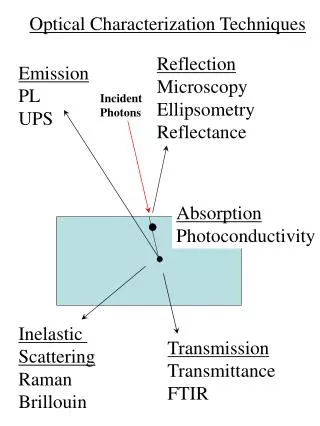
Attenuated Total Internal Reflectance Fourier Transform – Infrared Spectroscopy (ATI-FTIR) FTIR passes IR radiation through a sample, and measures the wavelengths at which energy is absorbed. Because molecules can vibrate by stretching, bending and twisting and absorb varying amounts of energy at each frequency, FTIR provides structural and chemical information. Above: spectrum of PDMS. Peaks include (A) C-H bond in Si-CH3 at 800 cm-1, (B) Si-O-Si bond at 1020 cm-1 and (C) C-H bond in Si-CH3 at 1260 cm-1.
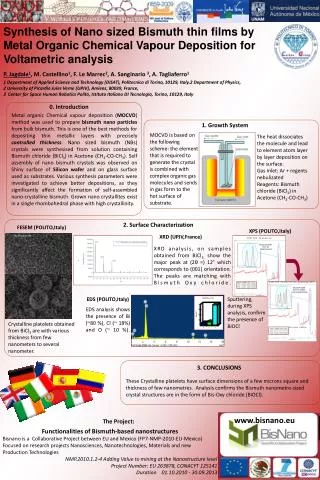
Secondary Mass Ion Spectroscopy (SIMS) In SIMS, ion bombardment sputters off surface ions (secondary ions) that are then counted. Spectra are compared to a database to determine species, quantity, orientation information. SIMS components: sample and ion gun, mass analyzer (filter), and processor/computer SIMS can damage surface, but gives quantitative data on composition as a function of depth in a sample
Transmission Electron Microscoy –Scanning Electron Microscopy (TEM, SEM) TEM in comparison to light microscopy. Above right: sperm cells in light microscopy, below right: sperm cells in a TEM
SEM SEM has great depth of focus. Left: osteoblast cells cultured on a titanium mesh. Right: schematic of an SEM Electrons can penetrate deeply into a sample, giving averaged chemical information with depth .
Scanning Probe Microscopy (SPM)Atomic Force Microscopy (AFM) AFM surface topography of poly (D,L-lactic acid)-poly(ethylene glycol)-monomethyl ether diblock copolymer Right: AFM instrumentation. Stylus is placed on sample surface. Laser tracks movement of stylus, and cantilever deflection is monitored. Stage is moved up and down to maintain contact between tip and sample. Above right: the greater the tip radius, the lower the spatial resolution.