Download
1 / 22
220 likes | 348 Views
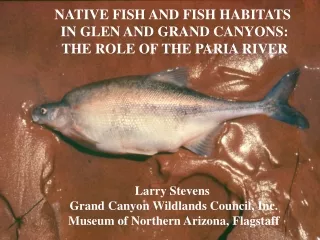
Non-native fish monitoring activities in Glen and Grand Canyons during 2000. Dave Speas, AGFD Carl Walters, UBC Scott Rogers, AGFD Bill Persons, AGFD. Objectives: Grand Canyon. Obtain population estimates of salmonids in Grand Canyon for use in assessing predation risks to humpback chub

E N D
Non-native fish monitoring activities in Glen and Grand Canyons during 2000 Dave Speas, AGFD Carl Walters, UBC Scott Rogers, AGFD Bill Persons, AGFD
Objectives: Grand Canyon • Obtain population estimates of salmonids in Grand Canyon for use in assessing predation risks to humpback chub • Evaluate strengths and weaknesses of longitudinal CPE/depletion/mark-recapture methods
2000 Hydrograph and Fishery Survey Trips *December Glen Canyon trip not shown
Population Estimate Approach • Theory: CPE=q(N), or catch rate is result of catchability coefficient (q) times local fish population. • Q derived through depletion electrofishing (multiple passes) and/or mark recapture experiments conducted at selected sites • Calibration of CPE to local fish population via q method applied to index (single pass) electrofishing samples collected throughout entire canyon • Resulting longitudinal curve and confidence bands were then integrated to obtain system-wide population estimates.
Depletion TheoryA Typical RBT Depletion Sample Example: No 98 fish (x intercept). Likelihood of No maximized given observed depletion data
Results • 560 index electrofishing samples collected between SWCA and AGFD • AGFD conducted 76 depletion and 20 mark/recapture experiments. • Only 9 experiments were conducted in turbid water (information need). • 877 salmonid stomach samples were collected (pending analysis)
Longitudinal Distribution of Rainbow Trout in Grand Canyon, 2000 N 743,000 RBT
Longitudinal Distribution of Brown Trout in Grand Canyon, 2000 N 57,000 BNT
Summary and Conclusions I: Grand Canyon • Longitudinal electrofishing surveys likely adequate for system wide salmonid population estimates, but variations in catchability need to be evaluated • Minimum annual sample size for salmonids approximately 240 samples to detect 20% change in brown trout CPE over 5 years; 2 trips/yr likely depending on importance of seasonal variance in q • Approximately 500,000-1,000,000 RBT in RM 18-225, occurring mostly in first 100 miles of river • Approximately 20,000-100,000 BNT in RM 18-225, occurring mostly in upper-middle Granite Gorge
Summary and Conclusions II: Grand Canyon • Estimates are likely biased negatively by depletion method (M/R estimates approximately 1.5X greater), but extrapolation assuming uniform fish density in river channel likely biases estimate positively • “Order-of-magnitude” estimates • Information needs: variations in catchability with high brown trout density, turbidity, seasons; cross-sectional fish distribution; reconciliation of depletion and M/R estimates
Glen Canyon • Objective: Monitor rainbow trout relative density, relative condition, size distribution and proportional stock density • Methods: Standardized electrofishing at 9 transects/trip, 4 trips (March, June, September, December)
Status of Rainbow Trout Fishery in Glen Canyon • CPE for all fish in 2000 (4.7 fish/minute) greater than 1999 (3.7 fish minute), but significance is marginal (P=0.0733) • CPE for age 2+ fish in 2000 (2.89 fish/minute) unchanged from 1999 • Mean relative condition unchanged from 1999 (Kn=77.9), peaked during June (slightly earlier than long term average) (MO: 0.90) • PSD (# >=406 mm/# >=305 mm) in 2000 (0.14) up slightly from 0.12 in 1999 (MO undetermined) • Percent age-0 and age-1 among highest on record (35-40%)
Summary and Conclusions: Glen Canyon • Relative condition and PSD largely unchanged from 1999, seasonal variation normal • High survival of YOY/juvenile RBT, though partially biased by electrofishing conditions (low, steady flows) • High persistence of YOY trout during 31K, although gear saturation possible
Number of brown trout captured in Glen Canyon during 1991-1998: 1Number of brown trout captured in Glen Canyon during 1999-2000: 5