Download
1 / 1

E N D
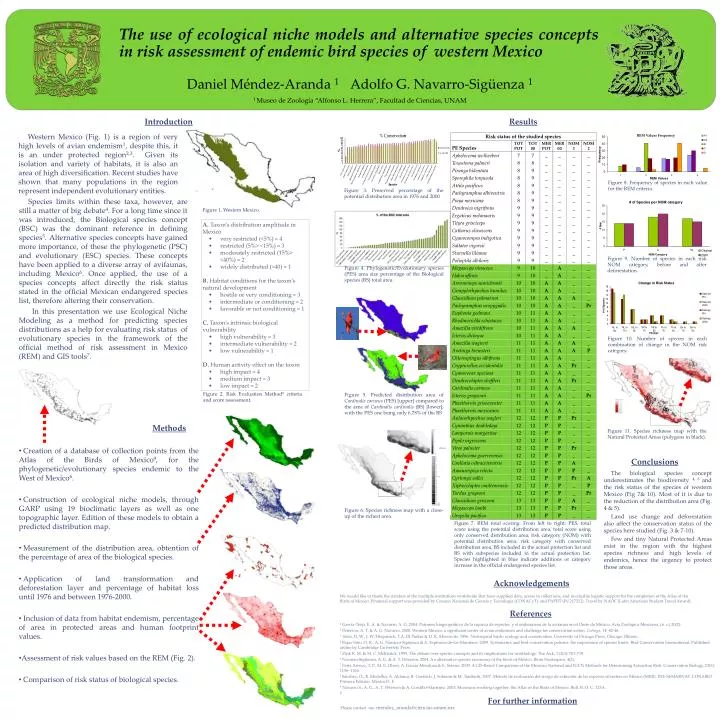
Western Mexico (Fig. 1) is a region of very high levels of avian endemism1, despite this, it is an under protected region2,3. Given its isolation and variety of habitats, it is also an area of high diversification. Recent studies have shown that many populations in the region represent independent evolutionary entities. The use of ecological niche models and alternative species concepts in risk assessment of endemic bird species of western Mexico Daniel Méndez-Aranda 1 Adolfo G. Navarro-Sigüenza1 Figure 1. Western Mexico. Creation of a database of collection points from the Atlas of the Birds of Mexico9, for the phylogenetic/evolutionary species endemic to the West of Mexico6. Construction of ecological niche models, through GARP using 19 bioclimatic layers as well as one topographic layer. Edition of these models to obtain a predicted distribution map. Measurement of the distribution area, obtention of the percentage of area of the biological species. Application of land transformation and deforestation layer and percentage of habitat loss until 1976 and between 1976-2000. Inclusion of data from habitat endemism, percentage of area in protected areas and human footprint values. Assessment of risk values based on the REM (Fig. 2). Comparison of risk status of biological species. 1García-Trejo, E. A. & Navarro, A. G. 2004. Patrones biogeográficos de la riqueza de especies y el endemismo de la avifauna en el Oeste de México. Acta Zoológica Mexicana, (n. s.) 20(2). 2 Peterson, A. T. & A. G. Navarro. 2000. Western Mexico: a significant center of avian endemism and challenge for conservation action. Cotinga, 14: 42-46. 3 Stotz, D. W., J. W. Fitzpatrick, T.A. III Parker & D .K. Moscovits. 1996. Neotropical birds: ecology and conservation. University of Chicago Press, Chicago, Illinois. 4 Rojas-Soto, O. R., A. G. Navarro-Sigüenza & A. Espinosa-de-los-Monteros. 2009. Systematics and bird conservation policies: the importance of species limits. Bird Conservation International. Published online by Cambridge University Press. 5 Zink R. M. & M. C. McKitrick. 1995. The debate over species concepts and its implications for ornithology. The Auk, 112(3): 701-719. 6 Navarro-Sigüenza, A. G. & A. T. Peterson. 2004. An alternative species taxonomy of the birds of México. Biota Neotropica, 4(2). 7 Feria Arroyo, T. P., M. E. Olson, A. García-Mendoza & E. Solano. 2009. A GIS-Based Comparison of the Mexican National and IUCN Methods for Determining Extinction Risk. Conservation Biology, 23(5): 1156–1166. 8 Sánchez, O., R. Medellín, A. Aldama, B. Goettsch, J. Soberón & M. Tambutti. 2007. Método de evaluación del riesgo de extinción de las especies silvestres en México (MER). INE-SEMARNAT, CONABIO. Primera Edición. México D. F. 9 Navarro S., A. G., A. T. Peterson & A. Gordillo-Martínez. 2003. Museums working together: the Atlas of the Birds of Mexico. Bull, B. O. C. 123A. 7 1 Museo de Zoología “Alfonso L. Herrera”, Facultad de Ciencias, UNAM The biological species concept underestimates the biodiversity 4, 6 and the risk status of the species of western Mexico (Fig 7& 10). Most of it is due to the reduction of the distribution area (Fig. 4 & 5). Land use change and deforestation also affect the conservation status of the species here studied (Fig. 3 & 7-10). Few and tiny Natural Protected Areas exist in the region with the highest species richness and high levels of endemics, hence the urgency to protect those areas. Conclusions Results Methods Introduction References Figure 8. Frequency of species in each value for the REM criteria. Figure 3. Preserved percentage of the potential distribution area in 1976 and 2000 Species limits within these taxa, however, are still a matter of big debate4. For a long time since it was introduced, the Biological species concept (BSC) was the dominant reference in defining species5. Alternative species concepts have gained more importance, of these the phylogenetic (PSC) and evolutionary (ESC) species. These concepts have been applied to a diverse array of avifaunas, including Mexico6. Once applied, the use of a species concepts affect directly the risk status stated in the official Mexican endangered species list, therefore altering their conservation. In this presentation we use Ecological Niche Modeling as a method for predicting species distributions as a help for evaluating risk status of evolutionary species in the framework of the official method of risk assessment in Mexico (REM) and GIS tools7. • A.Taxon’s distribution amplitude in Mexico • very restricted (<5%) = 4 • restricted (5%> <15%) = 3 • moderately restricted (15%> <40%) = 2 • widely distributed (>40) = 1 • B. Habitat conditions for the taxon’s natural development • hostile or very conditioning = 3 • intermediate or conditioning = 2 • favorable or not conditioning = 1 • C.Taxon’s intrinsic biological vulnerability • high vulnerability = 3 • intermediate vulnerability = 2 • low vulnerability = 1 • D. Human activity effect on the taxon • high impact = 4 • medium impact = 3 • low impact = 2 Figure 9. Number of species in each risk NOM category, before and after deforestation. Figure 4. Phylogenetic/Evolutionary species (PES) area size percentage of the Biological species (BS) total area. Figure 10. Number of species in each combination of change in the NOM risk category. Figure 2. Risk Evaluation Method8 criteria and score assessment. Figure 5. Predicted distribution area of Cardinalis carneus (PES) [upper] compared to the area of Cardinalis cardinalis (BS) [lower], with the PES one being only 6.78% of the BS Figure 11. Species richness map with the Natural Protected Areas (polygons in black). Figure 6. Species richness map with a close-up of the richest area. Figure 7. REM total scoring. From left to right: PES, total score using the potential distribution area, total score using only conserved distribution area, risk category (NOM) with potential distribution area, risk category with conserved distribution area, BS included in the actual protection list and BS with subspecies included in the actual protection list. Species highlighted in blue indicate additions or category increase in the official endangered species list. Acknowledgements We would like to thank the curators of the multiple institutions worldwide that have supplied data, access to collections, and invaluable logistic support for the completion of the Atlas of the Birds of Mexico. Financial support was provided by Consejo Nacional de Ciencia y Tecnología (CONACyT), and PAPIIT (IN 217212). Travel by NAOC (Latin American Student Travel Award). For further information Please contact me: mendez_aranda@ciencias.unam.mx