Download
1 / 35
350 likes | 565 Views
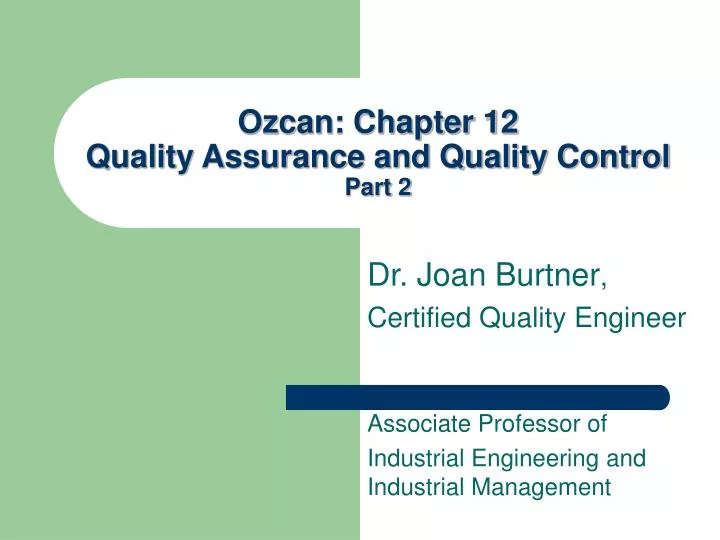
Ozcan: Chapter 12 Quality Assurance and Quality Control Part 2. Dr. Joan Burtner , Certified Quality Engineer Associate Professor of Industrial Engineering and Industrial Management. Topics. Part 1 Quality in Healthcare Quality Experts Quality Certification TQM & CQI Six-Sigma

E N D
Ozcan: Chapter 12Quality Assurance and Quality ControlPart 2 Dr. Joan Burtner, Certified Quality Engineer Associate Professor of Industrial Engineering and Industrial Management
Topics Part 1 Quality in Healthcare Quality Experts Quality Certification TQM & CQI Six-Sigma Part 2 Monitoring Quality through Control Charts Control Charts for Attributes Control Charts for Variables Process improvement Methods for Generating New Ideas Tools for Investigation 2 ISE 491 Dr. Joan Burtner Ozcan Chapter 12 Part 2
Quality Measurement and Control Techniques Process Variability 1 In the delivery of health care, there are many occasions when an error can happen in the tasks performed by various clinical staff. Often the same task may not even be performed the same way for all patients, though minor alterations within defined limits can be acceptable. When provider performance falls beyond acceptable limits, the errors that occur require investigation and correction. In order to detect noteworthy variations in process, or tendencies that may cause unacceptable levels of errors, healthcare managers must monitor the processes for quality, using various charts. The intent of the monitoring is to distinguish between random and non-random variation. 3 ISE 491 Dr. Joan Burtner Ozcan Chapter 12 Part 2
Quality Measurement and Control Techniques Process Variability 2 The common variations in process variability that are caused by natural incidences are in general not repetitive, but various minor factors due to chance and are called random variation. If the cause of variation is systematic, not natural, and the source of the variation is identifiable, the process variation is called non-random variation. In healthcare, non-random variation may occur by not following procedures, using defective materials, fatigue, carelessness, or not having appropriate training or orientation to the work situation, among many reasons. 4 ISE 491 Dr. Joan Burtner Ozcan Chapter 12 Part 2
Control Limits, Random and Nonrandom Sample Observations Upper Control Limit (UCL) Non-random Non-random +3σ Process Mean 99.7% Lower Control Limit (LCL) -3σ 1 2 3 4 5 6 7 8 9 10 11 12 Sample number Source: Ozcan Figure 12.4 (Modified for Three Sigma Limits) 5 ISE 491 Dr. Joan Burtner Ozcan Chapter 12 Part 2
Control Charts Overview Attributes Variables c-chart p-chart Mean-Charts X-bar Charts Range-Charts σ Method Range Method 6 ISE 491 Dr. Joan Burtner Ozcan Chapter 12 Part 2
Control Charts for Attributes When process characteristics can be counted, attribute-based control charts are the appropriate way to display the monitoring process. If the number of occurrences per unit of measure can be counted, or there can be a count of the number of bad occurrences but not of non-occurrences, then a c-chart is the appropriate tool to display monitoring. Counting also can occur for a process with only two outcomes, good or bad (defective); in such cases p-chart is the appropriate control chart because it is based on the binomial distribution. 7 ISE 491 Dr. Joan Burtner Ozcan Chapter 12 Part 2
Control Charts for Attributes: c-Chart 8 ISE 491 Dr. Joan Burtner Ozcan Chapter 12 Part 2
Control Charts for Attributes: c-Chart Example The number of infections from the Intensive Care Unit (ICU) at the ABC Medical Center over a period of 24 months is obtained. These numbers are the counts of stool assay positive for toxin, segregated by month. The patient population and other external factors such as change in provider have been stable. Source: Quantitatve Methods in Health Care Management The nurse manager who serves on the quality team wants to discover whether the infections are in control within 95.5% confidence limits. 9 ISE 491 Dr. Joan Burtner Ozcan Chapter 12 Part 2
Control Charts for Attributes: c-Chart Example Solution If we consider each month as a sample of bad quality outcomes, for 24 samples we have a total of 96 quality defects (infections), and the average would be: = 96/24 = 4.0. Since the z-value for 95.5% confidence level is equal to 2, using formulas we obtain: 10 ISE 491 Dr. Joan Burtner Ozcan Chapter 12 Part 2
ABC Medical Center Infection Control Monitoring UCL=8 Infections per month LCL=0 1 2 3 4 5 6 7 8 9 10 11 12 13 14 15 16 17 18 19 20 21 22 23 24 Sample number The resulting control chart based on 2 sigma limits indicates that the process is “in-control”. Typically, the control chart will include lines connecting the samples. 11 ISE 491 Dr. Joan Burtner Ozcan Chapter 12 Part 2
Control Charts for Attributes: p-Chart The proportion of defects in a process can be monitored using a p-chart that has binomial distribution as its theoretical base. The center of the p-chart represents the average for defects and LCL and UCL are calculated as: 12 ISE 491 Dr. Joan Burtner Ozcan Chapter 12 Part 2
Source: Quantitatve Methods in Health Care Management Control Charts for Attributes: p-Chart The indicator Family Satisfaction, which is part of the National Hospice and Palliative Care Organization’s survey, reflects the percentage of respondents who would not recommend the hospice services to others. The following data are from Holistic Care Corporation’s completed surveys from 200 families each month during a year, showing the number of respondents each month who expressed dissatisfaction with the organization’s services. The manager in charge of quality wishes to construct a control chart for this data within 95.5% confidence intervals. 13 ISE 491 Dr. Joan Burtner Ozcan Chapter 12 Part 2
Control Charts for Attributes: p-Chart Solution: First, we need to estimate the proportion mean, Total number of quality infractions 192 192 = -------------------------------------------- = ----------- = ------- = .08 Total number of observations 12(200) 2400 Since the z value for the 95.5% confidence level is equal to 2.0, using formulas we obtain: 14 ISE 491 Dr. Joan Burtner Ozcan Chapter 12 Part 2
Holistic Care Corporation’s Quality Monitoring UCL=0.118 Proportion of Families Dissatisfied LCL=0.042 1 2 3 4 5 6 7 8 9 10 11 12 Sample number The resulting control chart based on 2 sigma limits indicates that the process is not “in-control”. Since we are measuring dissatisfaction, points above the UCL are cause for concern. Typically, the control chart will include lines connecting the samples. 15 ISE 491 Dr. Joan Burtner Ozcan Chapter 12 Part 2
Control Charts for Variables Mean Charts - Standard Deviation Approach. In general the population standard deviation is unknown, and so the average of sample means and the standard deviation of sample distribution σ are used to construct the confidence limits as: . where σ 16 ISE 491 Dr. Joan Burtner Ozcan Chapter 12 Part 2
Source: OZCAN Figure 12.7 Use of Mean and Range Charts UCL Process Mean LCL Stable mean, increasing range process UCL LCL Increasing mean, stable range process Mean indicator Range indicator 17 ISE 491 Dr. Joan Burtner Ozcan Chapter 12 Part 2
Control Charts for Variables: Mean Chart, σ Method Example 12.3 With a time-motion study, the IV startup process has been examined in a medical center nursing unit for five weekdays to determine whether in the future, additional training of nurses is required. Each day 9 new patients’ IV startups were observed and the measurements recorded in minutes, as shown below. Construct 99.7% (z = 3) confidence limits for IV startup times. 18 ISE 491 Dr. Joan Burtner Ozcan Chapter 12 Part 2
Control Charts for Variables: Mean Chart, σ Method Solution Observation means for each day (sample) are calculated and are shown in the last rows of the following table. = (5.51+5.88+5.73+5.86+5.46) ÷ 5 = 5.69. with z = 3, n = 9 observations per sample (day), and s = 0.6, we obtain: 19 ISE 491 Dr. Joan Burtner Ozcan Chapter 12 Part 2
Control Charts for Variables: Mean Chart, Range Method Another way to construct a mean chart is to use the average of sample distribution ranges,. This approach requires a factor to calculate the dispersion of the control limits. . where A2 is a factor based on sample size See Table 12.1 for actual values. 20 ISE 491 Dr. Joan Burtner Ozcan Chapter 12 Part 2
Table 12.1 Factors for Determining Control Limits for Mean and Range Charts (for 3-sigma or 99.7% confidence level) Source: p. 143, Operations Management by Rusell & Taylor, 1995. 21 ISE 491 Dr. Joan Burtner Ozcan Chapter 12 Part 2
Control Charts for Variables: Mean Chart, Range Method Example 12.4 During 5 weekdays, each day the number minutes spent for each of 10 patient registration operations were observed in a time study as follows: 22 ISE 491 Dr. Joan Burtner Ozcan Chapter 12 Part 2
Control Charts for Variables: Mean Chart, Range Method Solution The overall mean for each sample and range is required to apply the formulas, using the range approach. Here each day is considered as a sample. The range is calculated by taking the difference between the maximum and minimum of each sample (day). The, mean for each day also is calculated and shown as follows: = (10.12+10.19+9.84+9.85+10.13) ÷ 5 = 10.03. = (2.4+2.4+1.6+1.6+2.3) ÷ 5 = 2.06. UCL = 10.03 + 0.31 (2.06) = 10.67. LCL = 10.03 – 0.31 (2.06) = 9.39. 23 ISE 491 Dr. Joan Burtner Ozcan Chapter 12 Part 2
Control Charts for Variables: Range Charts Process dispersion is best monitored by range charts. The control limits for range charts are constructed using factors. To calculate LCL, factor score D3 is obtained from a factor chart (Table 12.1) based on the number of observations in the sample distributions. Similarly, to calculate UCL, factor score D4 is required. Control limits for range charts using these factor scores are then constructed as follows: . 24 ISE 491 Dr. Joan Burtner Ozcan Chapter 12 Part 2
Control Charts for Variables: Range Chart Example Example 12.5 Use the information provided in Example 12.4 to construct a range chart. Solution For n = 10, D3 and D4 from Table 12.1 are 0.22 and 1.78, respectively. Using formulas we obtain: UCL = 1.78 (2.06) = 3.67. LCL = .22 (2.06) = 0.45. 25 ISE 491 Dr. Joan Burtner Ozcan Chapter 12 Part 2
Investigation of Control Chart Patterns Consistent patterns, even within the UCL and LCL indicate nonrandom causes that require investigation. Patterns include upward or downward runs, avoidance or presence in certain zones, and zigzagging patterns. The essence of the zone test rests on deviation from the center line by 1-sigma, 2-sigma, or 3-sigma limits. Zone C, zone B and Zone A are identified by these upper limits, respectively. . For ISE 491, we will use the tests listed in Minitab 15 to evaluate the existence of special cause variation in p-charts, c-charts, range charts and x-bar charts. 26 ISE 491 Dr. Joan Burtner Ozcan Chapter 12 Part 2
Control Chart Zone Test UCL +3σ +2σ +1σ CL -1σ -2σ -3σ LCL 1 2 3 4 5 6 7 8 9 10 11 12 Sample number 27 ISE 491 Dr. Joan Burtner Ozcan Chapter 12 Part 2
Process Improvement Methods Methods for Generating New Ideas: The 5W2H Approach Brainstorming Nominal Group Technique Interviewing Focus Groups Quality Circles Kaizen Teams Benchmarking . 28 ISE 491 Dr. Joan Burtner Ozcan Chapter 12 Part 2
Process Improvement Tools Tools for Investigating the Presence of Quality Problems and Their Causes Check Sheet Histogram Scatter Diagram Flow Chart Cause-and-Effect Diagram Pareto Chart . 29 ISE 491 Dr. Joan Burtner Ozcan Chapter 12 Part 2 Yasar A. Ozcan
Check Sheet and Histogram for Emergency Room Wait Times (Ozcan) 30 ISE 491 Dr. Joan Burtner Ozcan Chapter 12 Part 2
Scatter Diagram 31 ISE 491 Dr. Joan Burtner Ozcan Chapter 12 Part 2
Flow Chart X-Ray Order Process in an Emergency Department E.D. MD Requests X-ray NO Hand Write Patient Demographic Information Computer- Prepared Form Available? Obtain Form YES Physician Completes Form 1 32 ISE 491 Dr. Joan Burtner Ozcan Chapter 12 Part 2
Healthcare Cause and Effect Diagram Structure Functions Tests not coordinated Too many steps Lab/Rad./ER Depts. report to different VPs Delays in ordering tests Hospital room not available if admitted Test errors Patient Wait is Too Long Private MDs not on site Missing paperwork Lack of feedback Design is not efficient Lack of supplies Lack of transporters Lack of incentives Lack of ER beds Lack of automated system People Rewards Equipment/Material 33 ISE 491 Dr. Joan Burtner Ozcan Chapter 12 Part 2
Pareto Diagram 34 ISE 491 Dr. Joan Burtner Ozcan Chapter 12 Part 2
Contact Information Dr. Joan Burtner Quality Engineering Burtner_J@Mercer.edu 35 ISE 491 Dr. Joan Burtner Ozcan Chapter 12 Part 2