Download
1 / 34
340 likes | 451 Views
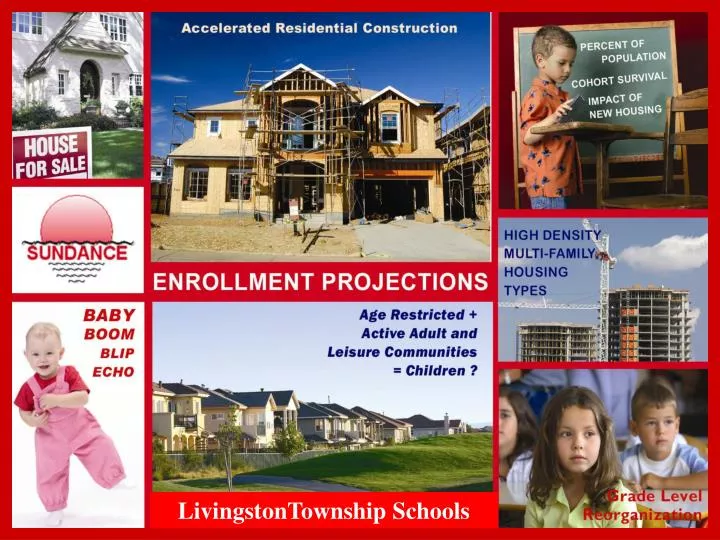
LivingstonTownship Schools. Introduction. Enrollment Projections 101 Livingston Twp. Demographics District & School Projections. 2. NJ DOE Enrollment Projections. Mandated Spreadsheet Format Long Range Facilities Plan Cohort Survival Methodology or Percent of Population

E N D
Introduction Enrollment Projections 101 Livingston Twp. Demographics District & School Projections 2
NJ DOE Enrollment Projections Mandated Spreadsheet FormatLong Range Facilities Plan Cohort Survival Methodologyor Percent of Population Based onHistoric Enrollments & Birth Rates Acceptable Modificationsthrough Certified Demographers Report Planning Sciences Statistical Analysis 3
Cohort Survival Method 220 Live Births were recorded in 1996 and 278 students entered Kindergarten in 2001CSR = 278/228 = 1.264 339 students in 2nd Grade in 2003 “survived” from 321 students in 2002CSR = 339/321 = 1.056 The 1st to 2nd Grade 5-Year Average CSR is 1.049 4
Cohort Survival Projection 223 Kindergarten students are factored by the 1.190 CSR to project 265 students in the 1st Grade of the first year of the projection The 1st to 2nd Grade 6-Year Average CSR is 1.049. The 256 students in 1st Grade are projected to survive as 278 2nd Graders 5
Modifications to Projections Charter Schools Private & Parochial School Status Interdistrict School Choice Program Changes in Curriculum: Early Ed, Special Ed Seasonal Fluctuations Impact of additional housing beyond the historic average Housing Mix : Types and Number of BedroomsMultipliers for Public School Children by housing type and number of bedrooms Impact of Age Restricted Housing on Existing Housing Re-Sales 6
Comparative Population Growth 30,127 29,366 9
Population Pyramid Child Bearing Age Male Female 11
Residential Resales 7.6% 5.2% Avg. Annual 13
Residential Construction 2005 peak = 411 5-year average = 16 14
Proposed Residential Construction 588 units of multi-family residential construction will impact the Livingston enrollment within 10 years. 15
Students from Residential Construction 125 new students will be generated from the four planned housing projects. 31 students arrive during the initial five-year projection. 94 students arrive during the extended five-year projection. 16
Demographics Summary 2000-2010 Population growth is minor Growth aligned with County, less than State Live Births Declining, in line with recession Pre-School and Childbearing Age populations all slightly decreasing School Age, Middle Age and Senior populations are increasing Residential Construction significant decrease but…four projects are planned Under 5 Age group decreased by 246 School Age group increased by 895 …so what’s up??? 19
Explanations and Implications It’s all about in-migration… The rate of turnover of existing housing with purchases by younger families in their early childbearing years is down. Trends to remain the same? Yes, except for Special Ed and Housing 20
District-wide Enrollment Projections 5862 Peak Historic increase of 181 students per year Projected growth of 148 students, then decline by 149 Extended overall decline of 84 students to new low 21
Pre-K to Gr 5 Enrollment Projections 13-year decrease of 269 students About 45 students per Grade Level 22
Gr 6-8 Enrollment Projections Overall 9-year increase of 198 students Ultimate decrease of 214 students 23
Gr 9-12 Enrollment Projections Overall 13-year increase of 288 students 24
Burnet Hill ES Enrollment Projections Overall 10-year decrease by 55 students 25
Collins ES Enrollment Projections Slow decrease of 51 students over 7 years 26
Harrison ES Enrollment Projections Slow decrease of 78 students over 10 years 27
Hillside ES Enrollment Projections Slow decrease of 81 students over 11 years 28
Mt. Pleasant ES Enrollment Projections Increase of 54 students over 6 years Decrease of 44 students over 7 years 29
Riker Hill ES Enrollment Projections 7-year valley resulting in 8 student decrease 8-year valley resulting in 14 student decrease 30
Mt. Pleasant MS Enrollment Projections Peak in year 2014 at 490 students 3-year and 4-year decreases, 134 students 31
Heritage MS Enrollment Projections Peak in year 2015 at 975 students 2nd Peak in 2020, ultimate 115 student decrease 32
Comparative Enrollment by Grade Level Organization Elementary enrollment peaked in 2006 Middle School Enrollment peaks in 2015 High School Enrollment peaks in 2019 33
Thank You Sundance Associates 117 Greenvale Ct. Cherry Hill, NJ 08034 Tel 856-755-0174 www.SundanceAssoc.com GSundell@SundanceAssoc.com 34