Download

1 / 74
750 likes | 936 Views
Qualitative Dependent Variable Models. Except for the LPM, estimation of binary choice models is usually based on maximum likelihood techniques. Each observation is treated as if it was a single draw from a Bernoulli distribution JHGLL, p. 44; Greene, p. 1026

E N D
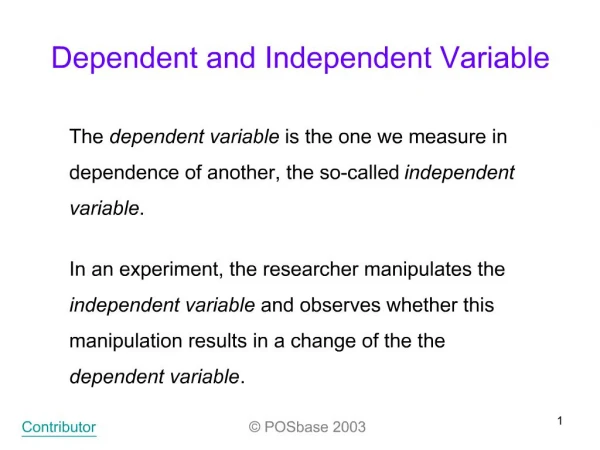
Qualitative Dependent Variable Models • Except for the LPM, estimation of binary choice models is usually based on maximum likelihood techniques. • Each observation is treated as if it was a single draw from a Bernoulli distribution • JHGLL, p. 44; Greene, p. 1026 • Consider an experiment in which only two outcomes are possible, 0 or 1 • y, the outcome of the experiment, is said to have a Bernoulli distribution • P(y = 1) = p and P(y = 0) = 1 – p where 0 ≤ p ≤ 1 • The PDF of y can be represented as: y can either be 0 or 1
Qualitative Dependent Variable Models • Maximum likelihood estimation of the discrete choice model • Define Pi* as the probability of observing whatever value of y that actually occurs for a given observation • Pr(yi=1|Xi)=F(Xiβ) Pr(yi=0|Xi)=1 − F(Xiβ) This is the result obtained from the latent variable interpretation General CDF
Qualitative Dependent Variable Models • The model • From above we represent the success probability by F(Xβ) • Assume we have independent “draws” • The joint probability of sample size T is: P(yi = 1) combination of 0’s and 1’s Product for those obs. with yi = 0 Product for those obs. with yi = 1 Total of T obs: i.e., an observation makes only 1 contribution to the joint PDF
Qualitative Dependent Variable Models • The total sample likelihood function for T observations is: • Notice what happens when yi = 1 or 0 • The contribution of an observation to the sample likelihood function will depend on whether it has an observed 0 or 1 value • An observation makes only one contribution to the likelihood function: F(Xβ) or 1-F(Xβ) • The total sample log-likelihood function: General CDF 4
Qualitative Dependent Variable Models • The FOC for maximization of the total sample LLF are: where fi is the PDF ≡ dF/d(Zi) Note what happens when y = 0 or 1 Xiβ In general, the partial derivative of a CDF wrt its argument is the PDF evaluated at that argument’s value:
Qualitative Dependent Variable Models • Choice of a particular functional form for F(·) generates the empirical model • Remember if the distribution is symmetric (e.g. normal, logistic) then 1− F(Xβ) = F(−Xβ) • If F(Xβ) is symmetric: qi ≡ 2yi – 1 • When yi= 0 → qi = −1 • When yi= 1 → qi = 1 • → you can simplify the above LLF: 6
Qualitative Dependent Variable Models • The FOC’s are a system of K nonlinear functions of β!! • Under most likely conditions this likelihood function is globally concave • Ensures uniqueness of the ML parameter estimates • Properties of Maximum Likelihood parameter estimates • Consistent, asymptotically efficient and asymptotically normally distributed around β
Qualitative Dependent Variable Models • How can we estimate βl? • As we derived under the general ML section: • The NR and BHHH are asymptotically equivalent but in small samples they often provide different covariance estimates for the same model
Qualitative Dependent Variable Models • The above shows the relationship between the curvature of the LF and βl. • The size of the variance is inversely related to the 2nd derivative. • The smaller the derivative the larger the variance. • Smaller 2nd derivatives • → flatter LF • → the harder to find a max and the less confidence in the solution
Qualitative Dependent Variable Models • The above LLF does not assume a particular CDF functional form • Standard Normal CDF: Probit Model • Logistic CDF: Logit Model
Qualitative Dependent Variable Models • If RV s is distributed standard normal: s~N(0,1) • If RV s is distributed logistic: s~logistic(0,π2/3) 11
Qualitative Dependent Variable Models • Remember for both the normal and logistic distributions we have: • Lets compare the logit vs. standard normal distributions • General Functional Forms • PDF’s • CDF’s 12
Qualitative Dependent Variable Models 13
Qualitative Dependent Variable Models 14
Qualitative Dependent Variable Models • Probit Model CDF: Φ(Xβ) • via chain rule Std. Normal PDF 15
Qualitative Dependent Variable Models • Logit Model CDF: 16
Qualitative Dependent Variable Models y*=Xβ+ε • Under the probit model we have: εi~N(0,1) → Pr(yi= 1) = Φ(Xiβ) • Probit total sample log-likelihood function std. normal CDF 17
Qualitative Dependent Variable Models • The FOC for maximizing L(β|y,X) are Eq. 19.2.19 in JHGLL
Qualitative Dependent Variable Models • We can further simplify the FOC’s for the probit model to be the following: 19
Qualitative Dependent Variable Models • One can show that the Hessian for the probit model is: Eq. 19.2.21 in JHGLL
Qualitative Dependent Variable Models • One can show that the above Hessian is negative definite for all values of β • → the LLF is globally concave • The asymptotic covariance matrix for the ML estimator of β can be obtained from: • The inverse of the Hessian evaluated at βML (NR method): • BHHH estimator: • Based on the inverse of the expected value of the Hessian evaluated at βML • Note there are yi’s in the Hessian
Qualitative Dependent Variable Models y*=Xβ+ε • Under the logit model we have εi ~logistically → • Logit sample log-likelihood function: • The FOC for maximizing logistic L are Logistic CDF Similar to probit
Qualitative Dependent Variable Models • One can show that the Hessian for the logistic model is: • Note that the LLF Hessian does not involve the RV yi unlike the Hessian for the standard normal LLF • One can show that the Hessian is always positive definite • →The LLF is globally concave
Qualitative Dependent Variable Models • Similar to the probit model, the asymptotic covariance matrix for the ML estimator of β can be obtained from our ML-based methods: • Based on the inverse of the Hessian evaluated at βML • BHHH estimator: • With y is not in the Hessian, ΣNR = ΣGN
Qualitative Dependent Variable Models • In summary, probit and logit functional forms are used to implement the above log-likelihood based-models • In terms of hypothesis testing: • Asymptotic characteristic of parameter estimates obtained from both logit and probit models: • Functional form varies and depends on whether estimating a Logit or Probit model
Qualitative Dependent Variable Models • Statistical significance of single parameter • Tests of general hypotheses • H0: Rβ = r J indep. hypotheses H1: Rβ ≠ r where • Remember that that above implies: True, unknown value
Qualitative Dependent Variable Models ∂H0/∂β • Under H0 • If λw > χ2J → reject H0 • λw/J ≈ FJ,T-K H0 Cov(R ) • Likelihood Ratio Test unrestricted coefficients restricted coefficients
Qualitative Dependent Variable Models • Lets test joint hypothesis that a subset of coefficients (say the last M) are zero • R=[0(K-M)|IM] • r=0M • ΣβM created first and then inverted (MxM) submatrix (Mx1) matrix =Rcov(β)R′ 28
Qualitative Dependent Variable Models • Joint test of all slope coefficients being 0 • Equivalent to the test that the model explains significantly more of the variability of the dependent variable then naïve model of no exogenous variable impacts • For both logit and probit models the restricted model can be represented as: L(βR) = T[P*ln(P*)+(1-P*)ln(1-P*)] where P* is the sample proportion of observations that have y = 1 • No need to actually estimate a restricted model • As Greene notes (p. 704), don’t use the LR test to test the Probit versus Logit model → no parameter restrictions available to go from one to the other
Qualitative Dependent Variable Models • As noted above: • Similar to the overall equation F-statistic in the CRM, you should include the χ2 test statistic for jointly 0 exogenous variable coefficients as you do not actually need to estimate a 2nd model • L(βR) = T[P*ln(P*) + (1-P*)ln(1-P*)] sample proportion = 1 30
Qualitative Dependent Variable Models • Whatever the assumed error term distribution, the parameters of the discrete choice model are not the marginal effects • In terms of the observed dependent (0/1) variable with the general CDF [F]: E(y|X) = 0[1-F(Xβ)] + 1F(Xβ) = F(Xβ) • In general we have: Two possible values of Y Z ≡ Xβ PDF
Qualitative Dependent Variable Models • For the standard normal distribution • For the logistic distribution • The above implies the marginal effect • Has the same shape as the associated PDF • Inflated or deflated by βi PDF>0 Greene, p. 775 32
Qualitative Dependent Variable Models • One can evaluate the above expressions • At sample means of your data • At every observation and use sample average of individual marginal effects • For small/moderate sized samples you may get different marginal effects depending on method used. • Train(2003) has a good discussion of predictions and the pros/cons of each method • When one has a dummy variable (D) • In general the derivative is with respect to a small continuous change • →It is not appropriate to apply when analyzing effect of a dummy variable
Qualitative Dependent Variable Models • For discrete exogenous variables the appropriate marginal effect (ME) is: Mean of other exogenous variables Pr(y = 1)= F(Xβ|X*,D,β)
Qualitative Dependent Variable Models • Under logit and probit specifications of the discrete choice model: • predicted probabilities and estimated marginal effects (for either continuous or discreet cases) are nonlinear functions of parameters. • To compute standard errors one can use the linear approximation (delta) method (Greene, p.68) • Can use numerical methods or use analytical results when implementing the delta method 35
Qualitative Dependent Variable Models • For example, the variance of the predicted probability of undertaking the activity: • Note that the above variance depends on the point of evaluation, X* X* is a point of evaluation Asy.Var(β) Predicted Probability estimated coeff. via chain rule (1 x 1) Predicted PDF
Qualitative Dependent Variable Models • What are the variances of changes associated with dummy variables? Predicted Probability Mean of variables except D
Qualitative Dependent Variable Models • What is the variance of the marginal effects of a change in X on the probability of occurrence where X is continuous? • i.e., is the Prob. of event related to X? • Lets define ∂F(Xβ)/∂X as γ where • The variance of the above marginal effects can be obtained from: PDF Marginal impact of X We are taking the derivative of the marginal effect wrt the β’s What do these derivative look like? 38
Qualitative Dependent Variable Models X* is a point of evaluation • With z ≡ X*β we have via the chain rule: Functional form will vary across error specification, i.e., probit or logit model Note at X* f(z) is a scaler and this is a vector 39
Qualitative Dependent Variable Models γ is the marginal effect on Pr(y=1) of a change in X • For the probit model we have: df/dz=dφ/dz= -zφ(X*β) z ≡ Xβ standard normal PDF a scalar With K parameters, the above covariance matrix will be (KxK)
Qualitative Dependent Variable Models γ is the marginal effect • For the logit model we have: z ≡ X*β f(z)2 41
Qualitative Dependent Variable Models • Goodness-of-Fit measures for discrete choice models • Dependent variable is not continuous so the use of R2 not appropriate • Should always report: • The LLF value for the full model • The LLF value with only the intercept which can be calculated directly from the data L(βR) = T[P ln(P) + (1-P)ln(1-P)] where P is sample proportion with y = 1 = average value of y • →you only have to run 1 model to obtain both LLF values 42
Qualitative Dependent Variable Models • Likelihood Ratio Index (Pseudo R2 Value) • Bounded between 0 & 1 • If all slope coefficients are indeed 0 → LU=L0→LRI=0 • No way to make LRI=1 although one can come close. • Estimated Φi(Xiβ) = 1 when y=1 • Φi(Xiβ) = 0 when yi = 0 • →LU = 0 (perfect fit) → LRI=1 • Again, you only need to estimate the original model, LU and L0: L0 = T[P ln(P) + (1-P)ln(1-P)] LU less negative than L0 Unrestricted L-value L-value when all exogenous variable coefficients set to 0
Qualitative Dependent Variable Models • Likelihood Ratio Index (Pseudo R2 Value) • The value has no natural interpretation with a value between 0 and 1 like R2 • However when comparing 2 models estimated with the same data and with same 0/1 choice (e.g., L0 the same under both) it is usually valid to say that the model with the higher LRI value is preferred • e.g. ↑ the value of L(•) is preferred • →2 models estimated using non-identical samples or w/different alternatives can’t be compared using LRI
Qualitative Dependent Variable Models • Ben-Akiva and Lerman(1985) define a measure of explanatory power based on the probability of correct prediction: • One problem is that for unbalanced data, less frequent outcomes are usually predicted poorly which may not be readily apparent in the above • Cramer(1999) has suggested a measure that addresses the above shortcoming: • Penalizes incorrect prediction • Given conditional means, not impacted by disproportionate sample sizes predicted prob of occur. Higher values are better avg. pred. probability
Qualitative Dependent Variable Models • Contingency Table used to summarize results • Categorizes hits/misses via the following prediction rule • , some critical value, 0 otherwise • F* usually set to 0.5 • Note, under the naïve model (everyone has predicted value of 1) • One always predicts 100P percent of observations correctly where P is the sample proportion with y=1 • → naïve predictor never has a zero fit • If the sample is unbalanced (e.g. many more 0’s or 1’s) you may not predict either a 1 or 0 using the above rule
Qualitative Dependent Variable Models • Contingency Table Observed Values y = 0 y = 1 Fi < F* TA TB Predicted Values TC Fi ≥F* TD TA+TB+TC+TD=T Correctly “predicted” You do not need to use 0.5 for F* May want to set F* relatively high (e.g. 0.75)
Qualitative Dependent Variable Models • Adjusted Count R2 (Long) • With a binary choice (0/1) model you will always have a “good” prediction as it is possible to predict at least 50% of the cases by choosing the outcome category w/the largest % of observed cases (0’s or 1’s) • For example, 57% of sample is in the paid labor force • → if your model predicts all individuals are working you will be correct 57% of the time • The Adjusted Count R2 controls for this
Qualitative Dependent Variable Models No. of correct quesses • Adjusted Count R2 • NC = number of choices • Nr+= marginal count of contingency table for rth row (e.g., sum of rth row) • Max(Nr+) ≡ maximum Nr+ value • njj= count with the jth row and column (e.g., correct prediction) • R2AdjCount = proportion of correct “guesses” beyond the number that would be correctly guessed by choose the largest marginal (e.g. predicting everyone works) Max(Nr+)
Qualitative Dependent Variable Models • Akaike’s Information Criterion (AIC) • -2LU ranges from 0 to +∞ w/smaller values indicating a better fitting model • Remember LU is ≤ 0 (i.e., sum of ln(Prob)) • As the number of parameters ↑ • −2LUbecomes smaller (better fit) • 2K is added as a penalty for ↑ number of parameters • Since number of obs.impacts total sample log-likelihood function value, LU, is divided by T to obtain per obs. value (ah-kah-ee-kay’s) Number of RHS including intercept