Download
1 / 38
380 likes | 555 Views
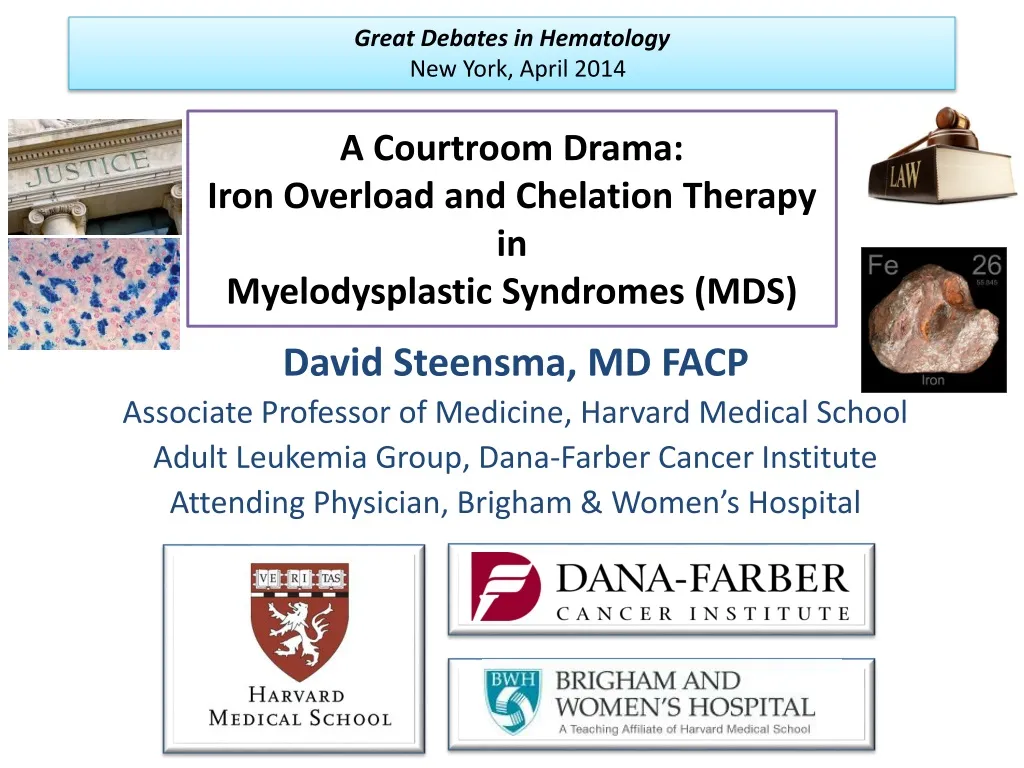
A Courtroom Drama: Iron Overload and Chelation Therapy in Myelodysplastic Syndromes (MDS). David Steensma, MD FACP Associate Professor of Medicine, Harvard Medical School Adult Leukemia Group, Dana-Farber Cancer Institute Attending Physician, Brigham & Women’s Hospital.

E N D
A Courtroom Drama: Iron Overload and Chelation Therapy in Myelodysplastic Syndromes (MDS) David Steensma, MD FACP Associate Professor of Medicine, Harvard Medical School Adult Leukemia Group, Dana-Farber Cancer Institute Attending Physician, Brigham & Women’s Hospital Great Debates in Hematology New York, April 2014
The Prosecution: Iron is dangerous in MDS, and a sentence of chelation is justified
Survival disadvantage for transfusion-dependent MDS patients: some of this must be iron (circa 250 mg per unit of RBCs) Cumulative probability of survival among patients given a diagnosis of MDS in Pavia, Italy, from 1992–2002 Cazzola, M. et al. N Engl J Med 2005;352:536-538
0 U pRBC/4 weeks 1 U pRBC/4 weeks 2 U pRBC/4 weeks 3 U pRBC/4 weeks 4 U pRBC/4 weeks 0 U pRBC/4 weeks 1 U pRBC/4 weeks 2 U pRBC/4 weeks 3 U pRBC/4 weeks 4 U pRBC/4 weeks Survival of MDS patients according to transfusion requirements: higher transfusion burden is associated with worse disease (for lower-risk MDS) Overall survival (HR = 1.36; p < 0.001) Leukemia-free survival (HR = 1.40; p < 0.001) 1.0 1.0 0.8 0.8 0.6 0.6 Cumulative survival Cumulative survival 0.4 0.4 0.2 0.2 0.0 0.0 0 20 40 60 80 100 120 140 160 180 0 20 40 60 80 100 120 140 160 180 Survival time (months) Survival time (months) Malcovati L, et al. Haematologica. 2006;91:1588-90
Serum ferritin is an independent prognostic factor in lower-risk patients with MDS Non-iron overload Iron overload 1.5 p = 0.001 p = 0.003 Iron burden affects survival > 1,000 µg/L SF threshold 1.0 Overall survival hazard ratio (per 500 µg/L serum ferritin) 0.5 0 Overall Transfusion-adjusted A 30% greater risk of death was evident for every 500 µg/L increase in SF above the 1,000 µg/L threshold Malcovati L, et al. Haematologica. 2006;91:1588-90
Ferritin 1st-3rd quartile Ferritin highest quartile 100 80 60 Overall survival (%) 40 p = 0.003 20 0 0 1 2 3 4 5 6 7 8 Outcome according to pre-transplant ferritin level in MDS patients transplanted at Dana Farber between 1997 and 2005 Ferritin 1st-3rd quartile Ferritin highest quartile 100 80 60 Disease-free survival (%) 40 p < 0.001 20 0 0 1 2 3 4 5 6 7 8 Ferritin 1st-3rd quartile Ferritin highest quartile Ferritin 1st-3rd quartile Ferritin highest quartile 100 100 80 80 60 60 Treatment-related mortality (%) Relapse (%) 40 40 p = 0.005 20 20 p = 0.7 0 0 0 1 2 3 4 5 6 7 8 0 1 2 3 4 5 6 7 8 Years from transplantation Years from transplantation Armand P, et al. Blood. 2007;109:4586-8
Prognostic impact of pre-transplantation transfusion historyand secondary iron overload in patients with MDS undergoing allogeneic stem cell transplantation: a GITMO study According to serum ferritin According to transfusion burden 1.0 ≤ 20 pRBC units, n = 64 21–40 pRBC units, n = 45 > 40 pRBC units, n = 26 1.0 Serum ferritin < 1,000 µg/L Serum ferritin 1,000–1,999 µg/L Serum ferritin 2,000–3,000 µg/L Serum ferritin > 3,000 µg/L 0.9 0.9 0.8 Cumulative proportion surviving 0.8 0.7 0.7 0.6 0.6 HR = 1.34p = 0.04 Cumulative proportion surviving 0.5 0.5 0.4 HR = 1.40p = 0.01 0.4 0.3 0.3 0.2 0.2 0.1 0.1 0.0 0.0 0 80 20 40 60 100 120 140 160 0 80 20 40 60 100 120 140 160 Time (months) Time (months) 1.0 1.0 0.9 0.9 HR = 1.42; p = 0.03 HR 1.47p = 0.021 Non-relapse mortality (probability) 0.8 0.8 0.7 0.7 0.6 0.6 Non-relapse mortality (probability) 0.5 0.5 0.4 0.4 Serum ferritin < 1,000 µg/L Serum ferritin 1,000–1,999 µg/L Serum ferritin 2,000–3,000 µg/L Serum ferritin > 3,000 µg/L ≤ 20 pRBC units, n = 64 21–40 pRBC units, n = 45 > 40 pRBC units, n = 26 0.3 0.3 0.2 0.2 0.1 0.1 0.0 0.0 0 80 20 40 60 100 120 140 160 0 80 20 40 60 100 120 140 160 Time (months) Time (months) Alessandrino EP et al. Haematologica 2010; 95:476-484
37/38 patients who died from cardiac/hepatic failure = serum ferritin ≥ 1,000 μg/L Probability of non-leukaemic death in patients with low-risk MDS Cardiac failure was more frequent in transfused patients (p = 0.01) 300 24% Cardiac 100 Hepatic 6.7% N=75 75 N = 467 200 Total number of pRBC units transfused 51 p = 0.0033 Percentage 50 31 25 8 8 100 0 0 Death caused by cardiac / hepatic failure Death from other causes Cardiac failure Infection Haemorrhage Hepaticcirrhosis Non-leukemic causes of death linked to iron overload? 1Takatoku M, et al. Eur J Hematol. 2007;78:487-94 2 Malcovati L, et al. J Clin Oncol. 2005;23:7594-603
100 82.4 81.0 67.1 62.9 55.7 44.4 40.4 50 37.1 14.6 6.2 1.0 0.7 0 Cardiacevents2003–2005 Diabetes2003–2005 Dyspnoea2003–2005 Hepaticevents2003–2005 Infectiouscomplications2003–2005 Fungalinfection2003–2005 Prevalence of comorbidities in transfusion-dependent MDS [based on claims data] With transfusion (n = 205) Without transfusion (n = 307) Patients (%) Transfused MDS patients have a higher prevalence of cardiac events, diabetes mellitus, dyspnoea, and hepatic and infectious diseases than non-transfused MDS patients (though “which came first” is unclear) Goldberg SL, et al. J Clin Oncol. 2010;28:2847-52.
French MDS T2* MRI study • 75 pts with MDS (40 male, 15 RAEB-1 or -2); median age 73 yrs • Median RBC units 76 (range 5-574); median 54 months of RBC transfusions (range 2-234) • 75% were being chelated • 11% of intermediate group (50-150 U) had concerning T2* values • Only 27% of high transfusion group had concerning values • A minority of those had cardiac dysfunction (LVEF <=35%) • No correlation between liver and cardiac MRI Pascal L et al (BJH 2013; 162, 413-415)
Non-transferrin-bound iron (NTBI) Normal: No NTBI produced Iron overload 100% LPI NTBI 30% • LPI = labile plasma iron: • redox-active • chelatable • membrane-permeant NTBI appears when plasma iron exceeds transferrin binding capacity (saturation > 60–70%)
LPI-induced oxidative stress ROS Lysosomes Mitochondrial damage Protein damage DNA damage Lipid peroxidation Promotion of genomic instability and progression of MDS via accumulation of new somatic mutations
Deferoxaminemesylate FDA approved April 1968 In use in Europe since ~1962 Available Iron Chelators Deferiprone (L1) FDA approved 2012 for thalassemia only EMEA approved August 1999 Deferasirox (ICL670) FDA approved November 2005 EMEA approved August 2006 Abbreviations: FDA = Food & Drug Administration, EMEA = European Medicines Agency
In congenital anemias, iron chelation is critical to survivalSurvival without cardiac disease according to the proportion of serum ferritin (SF) measurements >2500 ng/ml 1,00 < 33% of SF values > 2500 ng/ml 0,75 Proportion without cardiac disease 0,50 33-67% of SF values > 2500 ng/ml 0,25 > 67% of SF values > 2500 ng/ml 0,00 0 2 4 6 8 10 12 14 16 Years of chelation therapy Olivieri N et al. N Eng J Med 1994;331:574–578
Thalassemia major: Adherence to deferoxamine chelation therapy reported to improve survival well chelated patients 100 75 Survival (%) 50 poorly chelated patients 25 0 10 15 20 25 Age (years) Brittenham GH et al. N Engl J Med 1994;331:567–573
Effect of deferasirox on LPI in MDS 1.2 1.2 1.0 1.0 0.8 0.8 0.6 0.6 0.4 0.2 0.4 0 0.2 0 US03 study1 EPIC study – MDS cohort 2 Patients, n 55 38 39 37 34 Pre-administration Post-administration p 0.00001* Mean LPI SD (μmol/L) Mean LPI (µmol/L) Normal threshold Threshold of normal LPI (≤ 0.5 µmol/L) BL 3 6 9 12 Baseline 12 28 52 Months from baseline Time (weeks) Patients with baseline LPI ≥ 0.5 μmol/L = 41% 1. Data from List AF, et al. Blood. 2008;112:[abstract 634]. 2. Data from Gattermann N, et al. Leuk Res 2010;34:1143-50.
Vancouver study: Effect of iron chelation therapy on survival in lower-risk MDS patients Sub-group analysis 1.0 0.8 Iron chelation 0.6 Cumulative survival 0.4 0.2 No chelation HR = 0.29 (0.10–0.79) p = 0.01 0.0 0 50 100 150 200 250 Time (months) Leitch HA, et al. Clin. Leuk. 2008;2:205-11
1.00 1.00 0.75 0.75 0.50 0.50 0.25 0.25 0 0 0 50 100 150 200 250 0 20 40 60 80 100 120 140 GFM: Effect of iron chelation therapy on survival in lower-risk MDS patients IPSS = Low Median: 138 vs 70 months (p = 0.015) IPSS = Int-1 Median: 115 vs 36 months (p = 0.003) Chelated Chelated Survival distribution function Survival distribution function Non-chelated Non-chelated Time from diagnosis to death (months) Time from diagnosis to death (months) Results were the same regardless of sex and age. Rose C, et al. Leuk Res. 2010;34:864-70.
US registry study of chelatedvs non-chelated patients • N=600 with transfusional iron overload in 118 US centers (109 community) • Defined as ferritin >1000 ng/mL and either 20 U of RBCs or 6 units in last 12 weeks • Followed up to 5 years • Non-chelated patients more commonly IPSS higher risk (66% vs 56% chelated) Overall survival AML progression N=337 N=263 N=191 Lyons R et al Leuk Res 2014; 38:149-154
Hematopoietic improvement during chelation therapy • First reported in 1990s in MDS pts chelated with DFO • Numerous case reports and small case series in AA, PMF, and MDS since • Post-hoc analysis of EPIC MDS trial: • Erythroid response in 21.5% (53/247), median 109 days • Platelet response in 13.0% (13/100), median 169 days • Neutrophil responses 22.0% (11/50), median 226 days Jensen PD et al Br J Haematol1996; 94:288-99 Gattermann N et al Haematologica2012; 97:1364-71
250 25 226 200 20 169 150 15 115 109 99 100 10 50 5 0 0 Hematological responses in MDS patients treated with deferasirox: an EPIC post-hoc analysis using IWG 2006 criteria Percentage of patients experiencing haematological reponses Median time to haematological reponse 22.6 Hb/trans 19.6 Hb 14.0 Median time to response (days) Patients (%) Trans Any Erythroid Neutrophil Transfusion Platelet Hemoglobin Erythroid Platelet Neutrophil Gattermann N, et al. Blood. 2010;116:[abstract 2912]
Non-responder Non-responder Non-responder Responder Responder Responder 0 −200 −400 −600 −800 −1,000 −1,200 −1,400 Erythroid Platelet Neutrophil Hematological response according to median decrease in serum ferritin from baseline to end of study (EPIC trial post-hoc analysis) Median absolute change in serum ferritin from baseline (µg/L) Gattermann N, et al. Presented at ASH 2010. [Poster II-792].
US03 trial of deferasirox Patients, n 143 126 109 93 0 -200 -400 Mean change in serum ferritin (μg/L) -600 -800 -1,000 p = 0.0000015* -1,200 3 6 9 12 Months from baseline Change in mean (± SEM) serum ferritin *Comparison of baseline to 12 months List AF, et al. JCO 2012
The Defense: Iron is not guilty of the heinous crimes of which it is accused (the evidence is circumstantial), and a sentence of chelation would represent cruel and unusual punishment
Iron overload is of marginal clinical relevance for most patients with MDS “There are bigger fish to fry” – MDS is not thalassemia Blasts Progression Mutations Leukemia Iron No prospective trials show benefit from chelation therapy in MDS; all data are retrospective, subject to bias, and unconvincing “What we think we ‘know’, we don’t really know” Iron chelation therapy is costly and not well-tolerated “The cure can be worse than the disease”
Survival disadvantage for transfusion-dependent MDS patients Cumulative probability of survival among patients given a diagnosis of MDS in Pavia, Italy, from 1992–2002 Less bad disease Worse disease Cazzola, M. et al. N Engl J Med 2005;352:536-538
What we wish correlation between non-invasive markers of iron status such as serum ferritin and hepatic/cardiac iron concentration looked like … . Yang Z et al. Am J ClinNutr 2008;87:1892-1898
What it actually looks like… (Comparison of hepatic iron and serum ferritin concentrations in patients with thalassemia major) T2*/R2* MRI? Even in heavily transfused patients with MDS, incidence of heavy iron overload of liver and heart measured by these tests is low… Olivieri N F , Brittenham G M Blood 1997;89:739-761
Even among patients with RARS – who, due to longer life expectancy and peculiar iron trafficking, would be expected to be at highest risk for iron overload and easiest to show a benefit from chelation – the burden of iron and benefit of chelation is unclear Iron skeptic Chee CE, Steensma DP, Wu W, Hanson CA, Tefferi A Neither serum ferritin nor the number of red blood cell transfusions affect overall survival in refractory anemia with ringed sideroblasts. Am J Hematol 2008;83:611-3 Leitch HA, Chan C, Leger CS, Foltz LM, Ramadan KM, Vickars LM. Improved survival with iron chelation therapy for red bloodcell transfusion dependent lower IPSS risk MDS may be more significant in patients with a non-RARS diagnosis. Leuk Res 2012;36(11):1380-6. Strong chelation proponent
EPIC trial: adverse event rate highest in MDS group Cappellini MD et al., Haematologica 2010
Drop out rate: EPIC study MDS: 48.7% discontinuation rate by month 12 (highest among all diseases) Cappellini MD et al., Haematologica 2010
Treatment discontinuation rate: US03 study US03 patient disposition 45% of patients (n=78) dropped out in year 1: n=54 (31%) due to adverse events n=17 (10%) due to death, all unrelated to drug 42% of those who started year 2 dropped out List AF, Baer MR, Steensma DP, et al. Blood 2009;114:Abstract 3829.
MDS guidelines: varying recommendations for iron chelation therapy due to “lack of conclusive evidence”
“AlleDing' sind Gift, und nichtsohn' Gift; allein die Dosismacht, daßein Ding kein Gift ist.” All things are poison, and nothing is without poison; only the dose permits something not to be poisonous. I prefer the chemical physicians, for they do not consort with loafers or go about gorgeous in satins, silks and velvets, gold rings on their fingers, silver daggers hanging at their sides and white gloves on their hands, but they tend their work at the fire patiently day and night… They do not highly praise their own remedies, for they well know that the work must praise the master, not the master praise his work. They well know that words and chatter do not help the sick nor cure them. PhilippusAureolus Theophrastus Bombastus von Hohenheim, 1493–1541
TELESTO: prospective study of deferasirox in MDS Prospective, multicentre study to investigate the clinical benefit of chelation therapy with deferasirox (original enrollment goal 630, now 210) Primary study end-point: event-free survival (death, cardiac, and hepatic non-fatal events) 10 mg/kg/day (first 2 weeks); then 20 mg/kg/day Deferasirox Placebo Screening (1 month) 1 year 2 years 3 years 4 years 5 years Randomization (2:1 = deferasirox:placebo) http://clinicaltrials.gov/show/NCT00940602
What do I do currently? • Chelate, but only chelate people who: • Are likely to genuinely have a whole lot of iron (not just a high serum ferritin) • Are probably going to live long enough to make chelation worthwhile • Can afford chelation drugs • Are aware of and prepared for the risk or inconvenience of chelation drugs • Are willing to be closely monitored while on therapy For the interested reader: