Download
1 / 2
20 likes | 205 Views
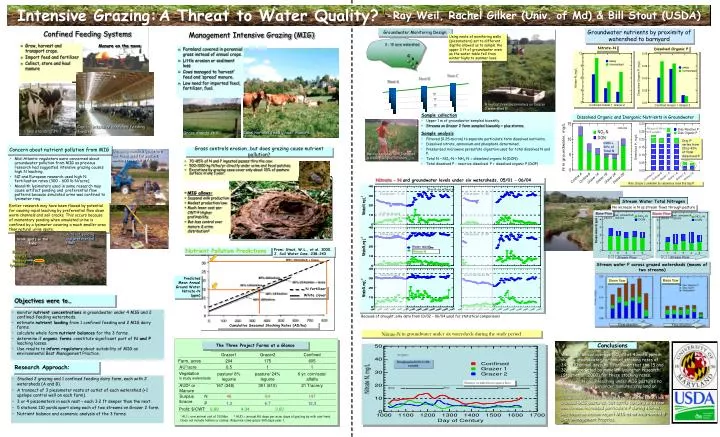
Groundwater Monitoring Design. From: Stout, W.L., et al. 2000. J. Soil Water Cons.:238-243. Nutrient Pollution Predictions. 3 - 15 acre watershed. Groundwater nutrients by proximity of watershed to barnyard. C. B. A. Nitrate-N. Dissolved Organic P. N fertilizer White clover.

E N D
Groundwater Monitoring Design From: Stout, W.L., et al. 2000. J. Soil Water Cons.:238-243 Nutrient Pollution Predictions 3 - 15 acre watershed Groundwater nutrients by proximity of watershed to barnyard C B A Nitrate-N Dissolved Organic P N fertilizer White clover Predicted Mean Annual Ground Water Nitrate-N (ppm) Nest C 2003 2004 2002 Nest B Nest A Stream Flow Stream Flow Cumulative Seasonal Stocking Rates (AD/ha) A nest of three piezometers on Grazer 2 watershed B Dissolved Organic and Inorganic Nutrients in Groundwater Capital intensive confined feeding facility Means of 106 to 160 samples Org. P varies from 20 to 43% of Total dissolved P DON = 20% of Total N Grass controls erosion…but does grazing cause nutrient pollution? Installing monolith lysimeters like those used for pasture leaching research in PA. Bailing samples from Confined A watershed piezometers. Concern about nutrient pollution from MIG • 70 -85% of N and P ingested passes thru the cow. • 500-1000 kg N/ha/yr directly under urine and fecal patches. • Excretions by grazing cows cover only about 15% of pasture surface in any 1 year. Confined Feeding Systems • Mid-Atlantic regulators were concerned about groundwater pollution from MIG as previous research had suggested intensive grazing causes high N leaching. • NZ and European research used high N fertilization rates (300 - 600 lb N/acre). • Monolith lysimeters used in some research may cause artifact ponding and preferential flow patterns because simulated urine was confined to lysimeter ring. Objectives were to… Note: Grazer 2 underlain by calcareous rocks that trap P Manure on the move • Grow, harvest and transport crops. • Import feed and fertilizer • Collect, store and haul manure • monitor nutrient concentrations in groundwater under 4 MIG and 2 confined-feeding watersheds. • estimate nutrient loading from 1 confined feeding and 2 MIG dairy farms. • calculate whole farm nutrient balances for the 3 farms. • determine if organic forms constitute significantpart of N and P leaching losses. • Use results to inform regulators about suitability of MIG as environmental Best Management Practice. The Three Project Farms at a Glance Nitrate - Nand groundwater levels under six watersheds, 05/01 – 06/04 • MIG allows: • Seasonal milk production • Modest production/cow • Much lower cost per CWT Higher profitability. • But less control over manure & urine distribution? Grazer1 Grazer2 Confined Farm, acres 204 175 605 Stream Water Total Nitrogen Earlier research may have been flawed by potential for causing rapid leaching by preferential flow down worm channels and soil cracks. This occurs because of momentary ponding when simulated urine is confined by a lysimeter covering a much smaller area than natural urine spots. AU1/acre 0.5 1 1 No increase in N as stream flows through pasture Vegetation in study watersheds pasture/ 8% legume pasture/ 24% legume 6 yr: corn/oats/ alfalfa High capital costs Base Flow Storm Flow AUD2 or Manure 167 (348) 351 (810) 21 T/acre/y • High production per cow and per acre. • High cost per CWT milk. Urine spots in the field Artifact ponding and preferential flow? Surplus lb/acre N 46 64 147 P 1.3 6.7 12.3 Relative size of leaching lysimeter Cows standing still Profit: $/CWT: 6.99 4.34 3.60 Water table Nitrate-N 1 AU = one animal unit of 1000lbs 2 AUD = annual AU days per acre, days of grazing by milk cow herd. Does not include heifers or calves. Assumes cows graze 365 days year-1. Base flow Storm flow Nitrate-N in groundwater under six watersheds during the study period Flow direction Flow direction Because of drought, only data from 10/02 – 06/04 used for statistical comparisons N=2700 Conclusions Drought period (5/01-11/02) excluded • We found annual average NO3-N of 4 and 6 ppm in shallow groundwater for annual stocking rates of 348-810 animal days/ha – far lower that the 15 and 32 ppm predicted by monolith lysimeter research (Stout et al., 2000) for these stocking rates. Distance weighted least squares lines Research Approach: • We found N and P leaching under MIG pastures no higher or lower than under manured cropland on confined dairy. • Stream water N and P did not increase as base flow crossed MIG pastures, but cattle camping area near one stream increased particulate P during storms. • We found no reason reject MIG as an environmental Best Management Practice. • Studied 2 grazing and 1 confined feeding dairy farm, each with 2 watersheds (A and B). • A transect of 3 piezometer nests at outlet of each watershed (+1 upslope control well on each farm). • 3 or 4 piezometers in each nest – each 3.2 ft deeper than the next. • 5 stations 110 yards apart along each of two streams on Grazer 2 farm. • Nutrient balance and economic analysis of the 3 farms. Intensive Grazing: A Threat to Water Quality? -Ray Weil, Rachel Gilker (Univ. of Md) & Bill Stout (USDA) Management Intensive Grazing (MIG) Using nests of monitoring wells (piezometers) set to different depths allowed us to sample the upper 3 ft of groundwater even as the water table fell from winter highs to summer lows. • Farmland covered in perennial grass instead of annual crops. • Little erosion or sediment loss • Cows managed to ‘harvest’ feed and ‘spread’ manure. • Low need for imported feed, fertilizer, fuel. Sample collection • Upper 1 m of groundwater sampled biweekly. • Streams on Grazer 2 farm sampled biweekly + plus storms. Cows harvest feed, “haul” manure Grass stands still Sample analysis • Filtered (0.25 micron) to separate particulate form dissolved nutrients. • Dissolved nitrate, ammonium and phosphate determined. • Pressurized microwave persulfate digestion used for total dissolved N and P. • Total N – NO3-N + NH4-N = dissolved organic N (DON) • Total dissolved P - reactive dissolved P = dissolved organic P (DOP) Stream water P across grazed watersheds (means of two streams)
Stream water P across grazed watersheds (means of 2 streams) Base flow Storm flow Flow direction Flow direction Watershed A