Download
1 / 33
330 likes | 447 Views
Improving Performance in Practice. On the road to a large scale system to improve outcomes for populations of patients DeWalt DA, McNeill J, Stanford K, Rome M, Margolis P. Funded by the Robert Wood Johnson Foundation. 1. http://creativecommons.org/licenses/by-nc-sa/3.0/. Outline.

E N D
Improving Performance in Practice On the road to a large scale system to improve outcomes for populations of patients DeWalt DA, McNeill J, Stanford K, Rome M, Margolis P Funded by the Robert Wood Johnson Foundation 1 http://creativecommons.org/licenses/by-nc-sa/3.0/
Outline IPIP purpose and design Intervention and evolution Data source and evaluation methods Results Interpretation 2
IPIP Program Purpose Align efforts and motivate action across primary care specialties and all levels of the health care system to transform care delivery Assist practices in re-designing care Initial focus on diabetes and asthma Spread to preventive services and other conditions Improve outcomes for populations of patients 3
IPIP: A Multi-Level Improvement Effort National State Network Practice Patient 4
IPIP Design—Practice Level Local improvement networks Data sharing for learning QI support for improvement networks and individual practices through quality improvement coaches State leaders, network leaders, and IPIP experience led to evolution of how these were operationalized This evolution and variation gives us the opportunity to learn about different effects 5
Practice Coaching • Onsite assessment of current systems • Onsite teaching and technical assistance • Team formation and practice engagement • QI methods (Model for Improvement) • Information systems advice • Measures and reporting • Interpretation of performance data • Recommended changes in care delivery • Improvement ideas • Linkage with collaborative improvement programs
Other Elements of Practice Support (Context) • The IPIP intervention is multifaceted • Other factors could affect improvement as much or more than coaching style or content • Collaborative improvement efforts • Practice selection • External motivators and incentives • External leadership • Recommended practice design changes
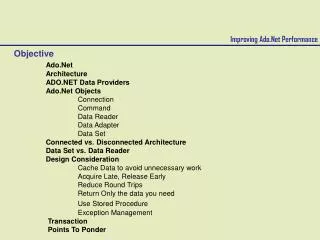
Objective • To evaluate outcomes of the IPIP improvement effort for three states in their first year
Measures • Process measures (e.g., % with DM with eye exam) • Outcome measures (e.g., % with DM with BP<130/80) • Implementation • Rated on scale of 0-5 • Registries • Protocols • Templates • Self-management support • Overall
Data Source • Practice reports own performance • Establish baseline • Takes number of months to stabilize data quality • Take baseline at stable data (biases toward null) • Assume no improvement if never achieve baseline (biases toward null) • States A and B started February 2007 • State C started June 2008
Analysis • Compare percent of practices with specified absolute improvement • >10% improvement in process measures • >5% improvement in outcome measures • Calculate average change in performance per month • Allows us to take into account different amount of time per practice • Based on difference between first stable month and final month 14
State A: 16 Practices State B: 12 Practices State C: 24 Practices Maximum months of analysis 16 16 12 Time to Data Stability
* Denotes statistically significant difference Preliminary Percent of Practices with >10% Improvement
Percent of Practices with >5% Improvement * Denotes statistically significant difference Preliminary
Mean Percent Improvement Per Month * Denotes statistically significant difference Preliminary
Mean Percent Improvement Per Month * Denotes statistically significant difference Preliminary
Self-Management Support Registry Implementation and Use A look under the hood
Limitations • Using data collected and reported by practices • Coaches often spent a lot of time on data reporting • Time to stable data led to underestimate of improvement • Statistical tests do not take advantage of repeated measures analysis (sorting out those models now)
Interpretation • Magnitude of improvement in process measures is similar to or greater than improvement seen in Health Disparities Collaborative evaluations • State C had more consistent improvement across measures, but the differences are not staggering at this point • Design of the practice support may affect results • Collaborative learning • Clear expectations • Payment
Where does this lead? • IPIP is creating a system for improving improvement • Variation provides opportunity for significant learning about systems required to drive improvement • Move toward more controlled variation • Now close to 250 practices nationwide • Growth of the program will offer more statistical power • With stable ongoing reporting, the data analysis will become easier and more robust • Any single intervention will have a modest effect • need to combine elements of practice support
American Board of Medical Specialties American Board of Pediatrics American Board of Family Medicine American Academy of Pediatrics American Academy of Family Physicians States of Colorado Michigan Minnesota North Carolina Pennsylvania Washington Wisconsin Acknowledgements Funded by the Robert Wood Johnson Foundation
Simplified Change Package • Registry to identify patients prior to visit • Templates for planned care (e.g., visit planner) • Protocols to standardize care • Standard Protocols • Nursing Standing Orders • Defined Care team roles • Self-management support strategies 29
IPIP National Key Driver Diagram Interventions Key Drivers 1. Communicate high expectations at all levels 2. Use multiple communication methods 3. Use structured participatory process for setting population-based goals and targets 4. Enumerate and describe entire population of practices 5. Plan for sustainable leadership 6. Develop leaders' improvement skills Accountable leadership focused on health outcomes • Partners assume responsibility for outcomes • Link to hospitals, public health organizations, quality organizations and others for resources, expertise, data, • Access to administrative data (e.g. hospitalizations) Partnerships that promote health care quality • Goals (by January 1, 2010) • 350 new practices participating • 90,000 new patients in denominators • Increase in clinical process measures • Improvement in clinical outcome measures 1. Maintenance of Certification 2. CME 3. Engage payers in design of rewards (e.g. Pay for Performance) 4. NCQA recognition Attractive motivators and incentives 1. Routine performance measurement 2. Transparency of comparative data 3. Standardized measures and definitions 4. Promote and support the effective use of registries Measure performance and share data • Create enduring collaborative improvement networks • Promote practice teams that improve rapidly (“super improvers”) • Share best practices in clinical and process improvements • Promote peer-to-peer communication • Ongoing cross-organizational and state learning • 2. Provide tools and information that promote evidence-based best practices • 3. Share knowledge and improve QI support Active participation in an organized quality improvement effort 30