Download
1 / 23
230 likes | 233 Views
This presentation examines the impact of structural based prediction on model building and application for the FVS-NI basal area increment model. It explores how data structure, assumptions, and methodology interact in model development. Performance and relevance of the model revisions are evaluated.

E N D
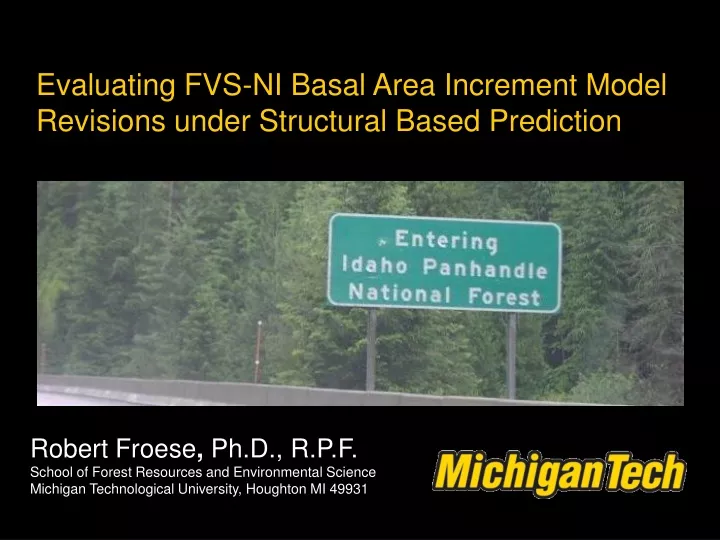
Evaluating FVS-NI Basal Area Increment Model Revisions under Structural Based Prediction Robert Froese, Ph.D., R.P.F. School of Forest Resources and Environmental Science Michigan Technological University, Houghton MI 49931
This presentation has four parts The issue, the question and the model formulations examined The methods and the data sets How does SBP affect model building and model application? How do data structure, assumptions and the methodology interact? Introduction Approach Performance Relevance
This presentation has four parts The issue, the question and the model formulations examined The methods and the data sets How does SBP affect model building and model application? How do data structure, assumptions and the methodology interact? Introduction Approach Performance Relevance
This presentation has four parts The issue, the question and the model formulations examined The methods and the data sets How does SBP affect model building and model application? How do data structure, assumptions and the methodology interact? Introduction Approach Performance Relevance
This presentation has four parts The issue, the question and the model formulations examined The methods and the data sets How does SBP affect model building and model application? How do data structure, assumptions and the methodology interact? Introduction Approach Performance Relevance
Competition variables have sampling error that varies in forestry problems • Why? • Inventory plot size and density are far from standardized in forestry • As a stand becomes patchy or older, sampling variance increases • Sampling errors attenuate regression coefficients towards zero, leading to type II errors in model development • If sampling variance of predictors is different between fitting and application ordinary least squares (OLS) regression coefficients are not unbiased
Fuller (1987) derived an unbiased estimator for the underlying linear structural model is a vector of covariances between errors in Y and X is a matrix of error variances and covariances for errors in X
Stage and Wykoff (1998) developed Structural Based Prediction • Derive estimators for sampling variance of competition variables • Estimate coefficients following Fuller’s (1987) logic • Revise coefficients during simulation to take into account the current estimate of sampling variance
This study had two objectives • Wykoff (1997) and Froese (2003) tested revisions using OLS and afterwards fit the model using SBP; would they have reached the same conclusions if they tested revisions using SBP? • SBP has not been tested on independent data. Does SBP perform in practice according to theory; namely, are predictions made using the DDS model fit using SBP less biased than predictions made with the model fit using OLS?
The Prognosis BAI model is a multiple linear regression on the logarithmic scale Wykoff 1997 Froese 2003
The approach involves two parts • evaluating model revisions • Froese 2003 revisions form the basis • Repeat under SBP using FIA data • compare RMSE of prediction residuals under OLS and SBP • testing on independent data • use the Froese 2003 model formulation, fit using FIA data under OLS and SBP • generate predictions for independent testing data • compare bias and RMSE of prediction residuals under OLS and SBP Introduction Approach Performance Relevance
The fitting data came from FIA inventories in the Inland Empire FIA “old” design 32,754 trees (80%) FIA “map” design 8,295 trees (20%) All increment data from increment cores!
The testing data came from the USFS Region 1 Permanent Plot Program 7,932 trees (44%) from control plots 10,659 trees (56%) from treated plots • Installed in managed stands, mostly pre-commercial thinning • Control plots were left untreated • Geographically restricted to National Forests • Coeur d’Alene, Flathead, Kanisku, Kootenai, Lolo and St. Joe • Diameter increment from successive re-measurements, not cores
Evaluating model revisions similar results for all species: • when change in precision due to revisions in the model formulation is assessed the outcome of revisions is more favourable under SBP • when change in precision due to the model framework is assessed, SBP always results in a degradation in model performance, but the degradation is less for every species under the revised DDS model formulation developed in Chapter 4 • SBP increased RMSE by 1.0 - 4.8% for the Wykoff 1997 version, but only 0.7 – 3.6% for the Froese 2003 version Introduction Approach Performance Relevance
SBP usually reduced bias as expected when applied to independent data
Predictions are similar in magnitude under each method, with exceptions
Trends in residuals across stand basal area were slightly improved with SBP Results for Pseudotsuga menziesii
Trends in residuals across PBAL were also slightly improved with SBP Results for Pseudotsuga menziesii
SBP effects may be overwhelmed by poor model performance on these data Results for Pseudotsuga menziesii
The effect of SBP is confounded with other issues in the test and test data • The test data are different in more ways than sampling design • SBP would be enhanced by methodological revisions • Poisson model • Estimation algorithm Introduction Approach Performance Relevance
SBP produces stable results despite complexity and confounding influences • model testing very encouraging • bias reduced for all species but those that have other problems • precision actually improved for most species • at minimum, these results suggest model users need not fear spurious results using the DDS model implemented with SBP
Summary Model revision decisions are insensitive to regression methodology SBP increases RMSE but decreases PRMSE SBP reduces bias in most situations as expected Methodological revisions are desirable