Download
1 / 27
270 likes | 275 Views
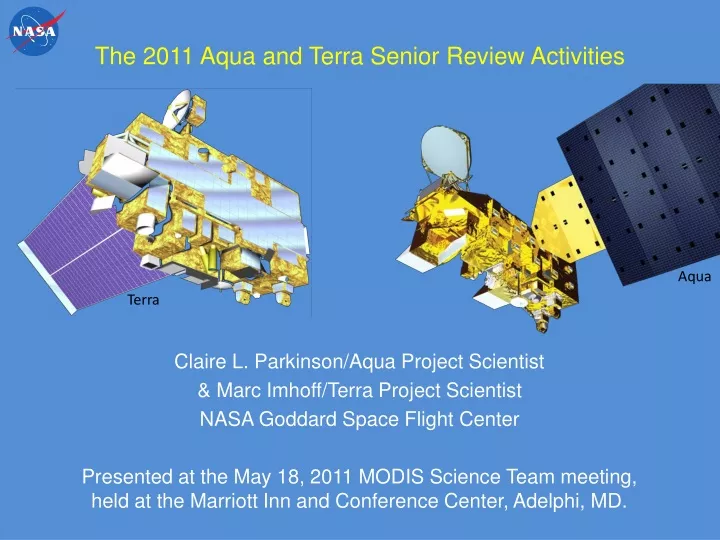
The 2011 Aqua and Terra Senior Review Activities. Aqua. Terra. Claire L. Parkinson/Aqua Project Scientist & Marc Imhoff/Terra Project Scientist NASA Goddard Space Flight Center

E N D
The 2011 Aqua and Terra Senior Review Activities Aqua Terra Claire L. Parkinson/Aqua Project Scientist & Marc Imhoff/Terra Project Scientist NASA Goddard Space Flight Center Presented at the May 18, 2011 MODIS Science Team meeting, held at the Marriott Inn and Conference Center, Adelphi, MD.
The Senior Review Process • Overview • Purpose: Review the Earth science missions that are beyond their prime-mission lifetimes, to determine which should continue and at what funding levels. • Missions reviewed: Aqua, Aura, CALIPSO, CloudSat, EO-1, GRACE, Jason-1, OSTM, QuikSAT, SORCE, Terra, and TRMM. • Schedule • 1/4/11, call letter received from NASA Headquarters (HQ) • 3/4/11, proposals due to NASA HQ • 4/11/11-4/15/11, Technical & Cost and National Interests Panels meet • 4/15/11, preliminary meeting of the Senior Review Panel • 4/18/11, questions received from the Senior Review Panel • 5/1/11, presentation files (answering the Panel questions) due to NASA HQ • 5/3/11-5/5/11, Senior Review Panel meets and each mission gives a presentation • 6/11, Panel report released • 7/11, new budget guidelines and instructions from NASA HQ • 8/11, revised project implementation plans due to NASA HQ CALIPSO = Cloud-Aerosol Lidar and Infrared Pathfinder Satellite Observations EO-1 = Earth Observing-1 GRACE = Gravity Recovery and Climate Experiment OSTM = Ocean Surface Topography Mission SORCE = Solar Radiation and Climate Experiment TRMM = Tropical Rainfall Measuring Mission
The Aqua Senior Review Proposal • Main sections • Executive Summary … 3 • 1. Introduction and Payload … 5 • 2. Science section … 7 2.1 Science objectives 2.2 Recent Science Accomplishments 2.3 Contribution to National Objectives/Applications 2.4 Planned Continued Production of Core Products 2.5 Summary of Programmatic Elements 2.6 On-line Bibliography • 3. Technical/Budget Section … 34 3.1 Technical Status of the Spacecraft, Instruments, and Ground Systems 3.2 Budget Narrative • 4. Acknowledgments … 45 • Appendices A. Aqua Data Product Summary … 46 B. Budget Spreadsheets … 62 C. Acronyms and Other Abbreviations … 69 D. References … 73 E. Engineering Data Tables and Figures … 78 • Budget Request • In-guide: $31.3 M for FY12, $32.0 M for FY13. • Over-guide: $0.6 M for FY12, $0.6 M for FY13.
The Terra Senior Review Proposal • Main sections • Executive Summary … 1 • 1. Science Merit … 3 1.1 Terra Mission Objectives … 3 1.2 Terra’s Science Payload … 4 1.3 Terra’s Science Contributions … 5 1.4 Relevance to NASA’s Science Plan … 6 • 2. Data Products… 20 • 3. Applied and Operational Uses … 30 • 4. Program Elements … 33 • 5. Technical Status of Mission Components … 39 • 6. Budget Narrative … 42 • Appendices A. Terra Product Contribution to Science Focus Areas (and Product Maturity) B. Budget Materials C. List of Acronyms D. References E. Terra Spacecraft Engineering Trends & Instrument engineering Data • Budget Request • In-guide: $30.6 M for FY12, $31.3 M for FY13. • Over-guide: $0.2 M for FY12, $0.2 M for FY13.
What Does the MODIS Team Get from the Senior Review Funding? • Operation of the Terra and Aqua spacecraft by the Earth Science Mission Operations (ESMO) at NASA GSFC • All spacecraft operations, including all spacecraft maneuvers. • All communications with the spacecraft. • Data flow from the spacecraft. • Information Technology (IT) security upgrades; space debris avoidance. • MODIS-specific funding • MODIS Characterization Support Team (MCST), including instrument operations • MODIS Science Data Support Team (SDST) • MODIS Administrative Support team (MAST), including MODIS Science Team coordination and meetings, MODIS Rapid Response, and the MODIS website • Science Team Leader support • Total 32 person years/year • Aqua and Terra Project Science Management • Outreach • Dynamic Planet • ViewSpace • Students’ Cloud Observations On-Line (S’COOL) • Earth/Sky radio broadcasts and podcasts • NASA Earth Observations (NEO) website
Senior Review Panel Question 1 for Aqua “Please present your optimal proposal budget; describe the additional work which will be funded by the optimal budget, the benefits of the added work, and justify the additional budget requested. 1a. Who would lead the development of the AIRS CO2 algorithm? 1b. Can you justify why the Science Team should be funded to do the AIRS CO2 rather than proposing this through a competitive proposal call such as ROSES? 1c. Can you demonstrate the need for the AIRS CO2 product? What are the science outcomes of this product? 1d. If the optimal budget is not funded, is this a lost opportunity, or is the necessary raw data still being collected, so that a future submission to ROSES could still fund the product development? 1e. How does the potential cost of validation of the AIRS CO2 product compare to the cost of algorithm development? 1f. What stage is the AIRS CO2 algorithm development at?”
The AIRS Mid-Troposphere CO2 Product (animation from Mous Chahine and the GSFC SVS) The scientific value of the AIRS CO2 product has been demonstrated in various papers on the general circulation (Feng et al. 2011), the El Nino Southern Oscillation (ENSO) (Jiang et al. 2008 and 2010), and the Madden-Julian Oscillation (Li et al. 2010).
Question 2 for Aqua: “As a flagship mission using a significant portion of the total MO & DA budget available, can the budget be reduced at all and still allow the core datasets to be delivered?” • Earth Science Mission Operations (ESMO) would have difficulties with further cuts. Several budget cuts have already occurred since 2002, and the following all entail additional costs: • IT security threats are becoming more sophisticated, resulting in additional IT security requirements. • Instrument and spacecraft anomalies have become more frequent. • Space debris has increased. • The science teams would also have difficulties with further cuts; the Panel was presented with a list of estimated impacts of a 3% cut in the science team budgets.
Question 3 for Aqua:“Could you please clarify how shared costs between Aqua, Terra, and Aura are allocated, and the criteria for this allocation?” • All ESMO Terra, Aqua, and Aura costs are shared except the costs for the flight teams and spacecraft manufacturer support. • Table of shared cost allocation, in $K: • Allocations are done for consistency with the guidelines from NASA HQ. Considerations include: • When Aura was launched, its costs were set as the added costs to run a third mission, and the HQ guidelines continue to provide Aura with that advantage. • Aura transmits less data than Aqua or Terra do. • Aqua and Aura both download data to the polar ground stations, which have many issues; Terra instead uses TDRSS.
Question 4 for Aqua:“What is the current and expected funding status for JAXA to continue to operate and maintain AMSR-E?” • Annual JAXA costs for AMSR-E are approximately $1.0-1.4 million. • Funding is granted only 1 year at a time. • JAXA plans to launch AMSR2 on GCOM-W between 11/1/2011 and 3/1/2012 and wants at least 1 year overlap between AMSR-E and AMSR2. • The topic will be discussed at the upcoming AMSR-E Science Team meeting, June 28-29. JAXA = Japan Aerospace Exploration Agency GCOM-W = Global Change Observation Mission – Water
Questions 5 and 6 for Aqua, BackgroundQuestion 5: “How critical is Aqua to the products derived from combinations of data collected from A-Train missions?”Question 6: “How critical are the other A-Train missions to combined products that use Aqua data?” • A-Train satellites • Current: Aqua, CloudSat, CALIPSO, and Aura • Former: PARASOL • Future: GCOM-W, OCO-2 • Many examples of studies using both Aqua and non-Aqua A-Train data were shown to the Senior Review Panel. The next slides show a few of those. PARASOL = Polarization and Anisotropy of Reflectances for Atmospheric Sciences coupled with Observations from a Lidar OCO-2 = Orbiting Carbon Observatory-2
NEWS Example in Which Both Aqua and non-Aqua Data are Integral in Obtaining New Results • The NASA Energy and Water cycle Study (NEWS) funds the generation of a Level 2 cloud-aerosol-radiation data product called C3M that combines CERES, CALIPSO, CloudSat, and MODIS data to produce shortwave (SW) and longwave (LW) heating rates and surface SW, LW, and net radiative fluxes. • MODIS provides column integrated cloud and aerosol properties as input to heating rate and surface flux calculations. • CERES provides top-of-the-atmosphere radiative fluxes. • CALIPSO provides vertical information on aerosol layers and aerosol type, plus layer information on thin clouds (with optical depth < 3). • CloudSat provides vertical information on thick cloud layers and identifies precipitating columns. • Combined passive (CERES and MODIS) and active (CloudSat radar and CALIPSO lidar) observations provide improved surface radiative fluxes, improved cloud detection in polar regions, and atmospheric heating rates according to cloud and aerosol type. 2 Annual JanApr Jul Oct JanApr Jul Oct 0 Sample plotted NEWS results, showing the downward LW flux calculated from CERES+MODIS minus the same flux calculated from C3M (from N. Loeb and the CERES Science Team). -2 (Wm-2) -4 -6 -8 60°N to 60°S Arctic Global -10
Studies in Which Both Aqua and non-Aqua Data are Integral in Obtaining New Results (addressing Questions 5 and 6), cont. • Combining CERES cloud albedo data and CloudSat precipitation data has revealed that precipitating clouds are significantly brighter than non-precipitating clouds, as illustrated with cloud-albedo probability distribution functions (PDFs) (from Stephens et al. 2008). • Combining cloud top pressure from MODIS (purple diamonds in image), cloud optical centroid pressure from Aura’s Ozone Monitoring Instrument (OMI) (pink triangles), and radar reflectivities from CloudSat (color scale, arbitrary units) has yielded new information about cloud vertical structure (from Joiner et al. 2010).
Studies in Which Both Aqua and non-Aqua Data are Integral in Obtaining New Results (addressing Questions 5 and 6), cont. • Correlation between MODIS visible/near-infrared cloud particle size and CloudSat radar reflectivity provides a unique identificaton of the transition from cloud to rain (Stephens et al. 2008). • Temperature and humidity data from AIRS, radar data from CloudSat, and lidar data from CALIPSO helped explain the remarkable decrease in Arctic sea ice in 2007 (see figure). Zonal mean profiles in the western Arctic during the 2006 and 2007 summer melt season, from CloudSat’s radar, CALIPSO’s lidar, and Aqua’s AIRS instrument (from Kay et al. 2008).
Example of Operational Synergistic Use of Aqua and non-Aqua A-Train Data The U.S. National Hurricane Center and U.S. Naval Research Laboratory (NRL) synergistically use AMSR-E and CloudSat radar data for weather applications. AMSR-E 89 GHz (top) and CloudSat radar (bottom) results for Hurricane Bill on 9/19/09.
Additional Examples Related to MODIS • MODIS helping other A-Train missions • The MODIS wide-swath results help to place the nadir-viewing CloudSat and CALIPSO results in a broader spatial context. • Using MODIS data to constrain the aerosol optical thickness improves the retrievals of aerosol single scattering albedo and aerosol layer height from OMI on Aura (Satheesh et al. 2009). • Other A-Train data helping MODIS • CloudSat has helped confirm the large effective radius obtained by MODIS over pristine oceans, and can be used to characterize drizzle and precipitation occurrence (Nakajima et al. 2010a, b). • Data from OMI on Aura have been used to identify above-cloud aerosol layers that are leading to biases in MODIS cloud optical thickness retrievals (Wilcox et al. 2009). These above-cloud aerosol layers also affect global aerosol forcing.
Question 7 for Aqua:“Is there any way to improve the data latency from 3 hours?” • Current latency is already considerably better than 3 hours, typically being no greater than 2 hours 6 minutes from observation to delivery. • Most of the current latency is due to limited spacecraft downlinks and slow network links to the ground stations (GS). • With funding, there are several ways to improve data latency. • Establishing a downlink to Antarctica could reduce latency by about 50 minutes. • Increasing network bandwidth from the GS could reduce latency by 12 minutes. • Data compression could further reduce latency from the GS. • For many data products, the ‘final product’ data latency is much greater. Near real time (NRT) production data set (PDS) Latency from Observation Start to Delivery: 126 Min LANCE NRT PDS:8 Min 3.5 Min Network File Transfer GS to GSFC Processing at GSFC Network File Transfer Latency on board Spacecraft 20 Min LANCE & NOAA RBD:10.5 Min 8 Min 94.5 Min Capture & Processing at GS Network File Transfer Rate buffered data (RBD) Latency: 125 Min 0 - 99 min some variation LANCE = Land, Atmosphere NRT Capability for EOS
Senior Review Panel Questions 1-4 for Terra “1. Please present your optimal proposal budget; describe the additional work which will be funded by the optimal budget, the benefits of the added work, and justify the additional budget requested. 2. Can new methane product be more completely described? … Please justify why this development should be done by the science team rather than under ROSES. 3. As a flagship mission using a significant portion of the total MO & DA budget available, can the budget be reduced at all and still allow the core datasets to be delivered? 4. Could you please clarify how shared mission operations costs between Aqua, Terra, and Aura are allocated, and the criteria for this allocation?”
Senior Review Panel Question 5 for Terra: “Provide more details on the process for selecting Terra products and criteria for deletion from list. What are the criteria for selection when some products have zero product maturity?” • All Core Mission Data Products are selected by the research community through ROSES or Senior Review. • - Deletion/non-deletion criteria include: • Data use (e.g., # of files and # of users). • Community valuation (i.e., product may be important despite small • number of users). • Interdependency – some data products used to generate other products. • Cost • As core data processing efficiency increases, deletions become less • attractive as cost saving device. • Deletion may require system changes - cost to archive minimal. - Specifics provided for each Terra instrument included the following for MODIS: The MODIS product selection process is to keep those products actively used by the science community, as indicated by publications, data distribution statistics, and user feedback, as well as any products needed for instrument health and safety and data product generation.
Senior Review Panel Question 6 for Terra: “Provide statistics/data on product use: What is the use of each product (quantitative comparison) and what is the use of products from each instrument?” Number of MODIS data granules distributed in 2010 by product type Number of MODIS data users in 2010 for each product type
Senior Review Panel Question 7 for Terra: “ASTER has lots of data products but it is not clear why some are ortho-rectified and others are not. Is there a reason?” • The orthorectified Level 1B product was developed by Japan as a special product. • The U.S. team saw the benefits and incorporated the Japanese software code for an additional Level 1B product about 3 years ago. • Some users have requested orthorectification for higher-level products, and this will be discussed at the June 2011 U.S./Japan ASTER Science Team meeting. Schematic showing ASTER on Terra, from the ASTER Science Team
Senior Review Panel Question 8 for Terra: “What issues prevent reducing data latency? The operational community would like to see data more quickly.” • Data latency is affected by satellite communications and scheduling (for all instruments) and data processing (instrument specific). • Satellite operations/communications • Most of the latency is due to limited spacecraft downlinks and slow network links to the ground stations (GS). • Adding a third space network TDRSS contact could reduce latency by ~17 minutes. (Currently there are two contacts per orbit.) • Increasing network bandwidth from the GS could reduce latency by up to 12 minutes. • Each Terra instrument team responded individually regarding data processing/latency. The MODIS response is on the next slide.
MODIS Response on Data Latency (Question 8 for Terra) • Standard MODIS Level 1 and Level 2 (swath-based) science products are produced within 25 to 41 hours of observation. • Latency is driven by the time required for the Level 0 data to arrive from EDOS and the definitive attitude and ephemeris files to arrive from the Flight Dynamics Facility. • MODIS Rapid Response system was developed soon after launch to meet the needs of MODIS operational users, initially for near real time fire detection. • Starting in 2010, latency was improved for operational products and now averages 1 hour and 40 minutes. • EDOS improved delivery of the Level 0 data by 12.5 minutes. • ESDIS Project developed the Land and Atmosphere Near-real time Capability for EOS (LANCE) http://lance.nasa.gov/ • Comprised of near real time data systems for MODIS, OMI, AMSR-E and AIRS. • MODIS component of LANCE processes data from a single contact rather than waiting for two hour files of time-ordered Level 0 data. • It also uses ancillary data that are available quickly, rather than waiting for the best ancillary input (the higher quality standard science products still wait for these data). • Latency for Terra MODIS products and imagery is measured from the time of observation by the satellite to the availability of all products for distribution. EDOS = EOS Data and Operations System ESDIS = Earth Science Data and Information System
References, p. 1 • Feng, L., P.I. Palmer, Y. Yang, R. M. Yantosca, S. R. Kawa, J.-D. Paris, H. Matsueda, T. Machida, 2011: Evaluating a 3-D transport model of atmospheric CO2 using ground-based, aircraft, and space-borne data, Atmos. Chem. Phys., 11, 6, 2789-2803. • Jiang, X., Q. Li, M.-C. Liang, R.-L. Shia, M. T. Chahine, E. T. Olsen, L. L. Chen, and Y. L. Yung, 2008: Simulation of upper tropospheric CO2 from chemistry and transport models, Global Biogeochem. Cycles, 22, GB4025, doi:10.1029/2007GB003049. • Jiang, X., M. T. Chahine, E. T. Olsen, L. L. Chen, and Y. L. Yung, 2010: Interannual variability of mid-tropospheric CO2 from Atmospheric Infrared Sounder, Geophys. Res. Lett., 37, L13801, doi:10.1029/2010GL042823. • Joiner, J., M. R. Schoeberl, A. P. Vasilkov, L. Oreopoulos, S. Platnick, N. J. Livesey, and P. F. Levelt, 2009: Accurate satellite-derived estimates of the tropospheric ozone impact on the global radiation budget, Atmos. Chem. Phys. Discuss., 9, 5505–5547, http://www.atmos-chem-phys-discuss.net/9/5505/2009/. • Joiner, J., A. P. Vasilkov, P. K. Bhartia, G. Wind, S. Platnick, and W. P. Wenzel, 2010: Detection of multi-layer and vertically-extended clouds using A-train sensors, Atmos. Meas. Tech., 3, 233-247. • Kay, J. E., T. L’Ecuyer, A. Gettelman, G. Stephens, and C. O’Dell, 2008: The contribution of cloud and radiation anomalies to the 2007 Arctic sea ice extent minimum, Geophys. Res. Lett., 35, L08503, doi:10.1029/2008GL033451.
References, p. 2 • Li, K. F., B. Tian, D. E. Waliser, and Y. L. Yung, 2010: Tropical mid-tropospheric CO2 variability driven by the Madden-Julian oscillation, PNAS, 107 (45), 19171-19175, doi:10.1073/pnas.1008222107. • Nakajima, T. Y., K. Suzuki, and G. L. Stephens, 2010a: Droplet growth in warm water clouds observed by the A-Train. Part I: Sensitivity analysis of the MODIS-derived cloud droplet size, J. Atmos. Sci., 67, 1884-1896. • Nakajima, T. Y., K. Suzuki, and G. L. Stephens, 2010b: Droplet growth in warm water clouds observed by the A-Train. Part II: A Multi-sensor view, J. Atmos. Sci., 67, 1897-1907, doi: 10.1175/2010JAS3276.1. • Satheesh, S. K., O. Torres, L. A. Remer, S. S. Babu, V. Vinoj, T. F. Eck, R. G. Kleidman, and B. N. Holben, 2009: Improved assessment of aerosol absorption using OMI-MODIS joint retrieval, J. Geophys. Res., 114, D05209, doi:10.1029/2008JD011024. • Stephens, G. L., D. G. Vane, S. Tanelli, E. Im, S. Durden, and 15 others, 2008: CloudSat mission: Performance and early science after the first year of operation, J. Geophys. Res., 113, D00A18, doi:10.1029/2008JD009982. • Wilcox, E. M., Harshvardhan, and S. Platnick, 2009: Estimate of the impact of absorbing aerosol over cloud on the MODIS retrievals of cloud optical thickness and effective radius using two independent retrievals of liquid water path, J. Geophys. Res., 114, D05210, doi:10.1029/2008JD010589.