Download
1 / 86
950 likes | 1.23k Views
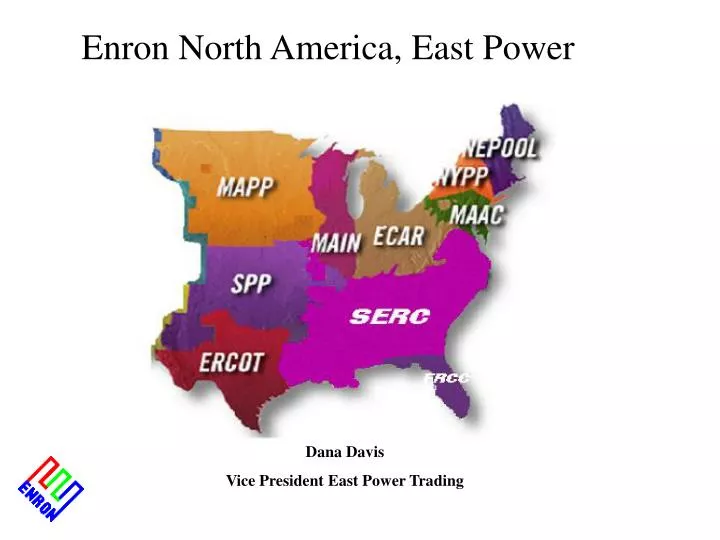
Enron North America, East Power. Dana Davis Vice President East Power Trading. East Power. Southeast. Midwest. ERCOT. Northeast. Structuring. Development. Fundamentals.

E N D
Enron North America, East Power Dana Davis Vice President East Power Trading
East Power Southeast Midwest ERCOT Northeast Structuring Development Fundamentals • Maintain site bank at current levels (30 sites in 14 states) and expand site bank in select strategic regions • Monetize sites and associated development assets • Utilize existing sites for leverage into higher proposition structured transactions • NEPOOL • NYPP • PJM • SERC • SPP • FRCC • MAIN • MAPP • ECAR • ERCOT (TX) • Maintain integrity of risk assessment/ valuation • Deal structure development • Be a primary training and development ground for future commercial talent in Origination and Trading • Create deal flow efficiencies • Leverage the analyst and trading track program to improve and deliver better fundamental data and processes • Create an education and training plan for core staff in the fundamentals group • Evaluate/Procure leading edge fundamental and technical analysis tools and products that support East Power Trading Northeast • Focused on financial markets (broker,OTC, exchanges) and physical customer markets (IOU, IPP, Muni, Cooperative, and Industrial) • Make markets at the trading hubs to promote liquidity and price transparency • Customer penetration brings information and high yield structured transactions
Eastern Interconnect Grid Overview • Consists of the following NERC regions: • NEPOOL • NYPP • PJM • ECAR • MAIN • Approximately 600,000 MW of installed capacity • 44% coal • 29% gas • 14% nuclear • Distinct summer and winter daily load profile • Graphical description to come for each NERC region • The majority of maintenance outages occur in the spring and fall • Capacity margin for 2001 is approximately 13% • Capacity margin is defined as the excess installed capacity over peak load (considered reserve) • MAPP • SPP • FRCC • SERC
North America Physical Power Volumes (Million MWh) 579 402 381 192 +52% 1997 1998 1999 2000
EnronOnline – “The” Energy Market-Maker (Average Daily Transactions) EnronOnline Traditional 4,922 4,042 3,539 3,463 3,171 3,049 3,076 2,761 2,165 2,166 1,898 1,499 917 650 1999 2000 Expanded Market Reach, Scalability, Information and Liquidity North America Natural Gas and Power Transactions
Trading Platform: Enron Online Price Term Region
Physical Firm Products • 50MW blocks • On peak: - 6:00 a.m. – 10:00 p.m. • Off peak: - 12:00 a.m. –6:00 a.m. - 10:00 p.m. – 12:00 p.m.
Financial Swap • Floating Price • Settled against Megawatt Daily • Fixed Price - As shown on EOL
Load Forecasting Short Term Daily Forecasts Long Term Forecasts Temperature Sensitivities
Northeast Power ISO’s • PJM – Pennsylvania, New Jersey and Maryland • NEPOOL – New England Power Pool • NYISO – New York Independent System Operator
What is an “Independent System Operator?” • A concept developed by the Federal Energy Regulatory Commission (FERC) as part of the $320 billion electric industry in the U.S. • Key principles: > non-discriminatory governance structure. > facilitating market based wholesale electric rates. > ensuring for the efficient management and reliable operation of the bulk power system.
Northeast Peak Loads • PJM • Summer 2000 – 49,417 MW • Winter 2000 – 42,395 MW • All Time Peak Load – 51,700 MW • NEPOOL • Summer 2000 – 21,992 MW • Winter 2000 – 20,193 MW • All Time Peak Load – 22,609 MW • NYISO • Summer 2000 – 28,138 MW • Winter 2000 – 24,118 MW • All Time Peak Load – 28,138 MW
Major Players in the Northeast • PJM • Public Service Electric and Gas (PSEG) • PECO/Exelon • Pennsylvania Power and Light (PPL) • NYISO • Consolodated Edison (New York and Long Island • PECO/Exelon • NRG Energy • NEPOOL • Pacific Gas and Electric (PG&E) • Northeast Utilities • Sithe
PJM Statistics Complexity: • 540 Generation Sources with Diverse Fuel Types • 8000 Miles of Transmission • Manage Assets with a Cost in Excess of $5.5 Billion • Over 22 Million People Served Uniqueness: • Six jurisdictions ( PA, NJ, MD, VA, DEL, DC ) • Single Control Area in NERC Region Energy Transaction Volumes: • Transmission Service Requests: Over 150 Million MWh • Energy Transacted: Over 8 Million MWh/Month • Energy Market Schedules: Over 8,000 Monthly • Tariff & Operating Agreement Billings: In excess of $800 Million Annually • Participants Trained: Approximately 3000 • Customer Service Phone Calls: Over 15,000 Membership: • 140+ Participants • 80 Transmission Service Customers
PJM Market Design • Supports many options for energy traders • Balanced bilateral transactions (i.e. scheduling coordinator) with no spot market backup • Bilateral transactions with implicit spot market backup • Submit flexible generation offers and demand bids • Two Settlement System • Suppliers offer & customers bid day-ahead prices and quantities into PJM market (first settlement) • Suppliers offer in real-time market to supply incremental requirements (second settlement)
PJM Market Mechanisms • Supports a variety of financial contracts that are separate from the physical spot market • Forward Energy Market • PJM Trading Hubs & NYMEX Contract • Day-ahead Market (Two-Settlement system) • Financial Transmission Rights • Financial Energy Contracts • PJM eSchedules
PJM Spot Market • Voluntary offer-based market • Unit specific (start-up, no-load and energy bids) • Slice of system (energy only) • Offers “locked in” by noon day before • Internal units market-based or may be cost-capped • Energy pricing based on Locational Marginal Pricing (nodal pricing) with overlying zones & trading hubs • Central unit commitment & security constrained dispatch • Network customers are not required to schedule expected use (free flowing ties); must bid in designated resources • Non-Network Customers must schedule expected use of spot market (voluntary)
Transmission System Congestion • Transmission system congestion occurs when available, low cost supply cannot be delivered to the demand location due to transmission limitations • As Market Participants compete to utilize the scarce transmission resource, the ISO needs an efficient, non-discriminatory mechanism to deal the congestion problem
Options for Energy Supply Self-schedule their own resources PJM Spot Market Load Serving Entities obtain energy to serve customers Bilateral Transactions CUSTOMERS Industrial Commercial Residential
Transmission System Congestion • The PJM Market uses Locational Marginal Pricing (Nodal Pricing) to manage transmission congestion • The PJM Market also includes overlying trading hubs and zones to provide standard energy products for the commercial markets • The PJM Market includes FTRs (Financial Transmission Rights) to allow participants to manage congestion risk
Locational Marginal Price Generation Marginal Cost LMP = + + Cost of Marginal Losses Transmission Congestion Cost Cost to serve the next MW of load at a specific location, using the lowest production cost of all available generation, while observing all transmission limits
What is LMP? • Pricing method PJM uses to … • price energy purchases and sales in PJM Market • prices transmission congestion costs to move energy within PJM Control Area • Physical, flow-based pricing system • how energy actually flows, • NOT contract paths
Economic Dispatch Highest Cost Generator Not Dispatched I need MWs. Sale goes to the MW lowest bidder with capacity. 300 MWs @ $10 $10 Going once.... Load Capacity 499 MWs 300 MWs 199 MWs @ $15 MW $15 Capacity PJM $15 200 MWs Market Clearing Price MW Not Dispatched $20 Capacity 200 MWs
Economic Dispatch Highest Cost Generator Sets Price I need MWs. MW Sale goes to the $10 300 MWs @ $10 lowest bidder with capacity. Going once.... Capacity Load 300 MWs 599 MWs MW $15 200 MWs @ $15 Capacity 200 MWs PJM $20 MW Market Clearing Price $20 99 MWs @ $20 Capacity 200 MWs
Power Transfer Limits Thermal Limits Voltage Limits Stability Limits
Control Actions 240 MW Sundance E D Thermal Limit Brighton A Solitude B C Alta Park City System Reconfiguration Transaction Curtailments Re-dispatch Generation
LMP Characteristics • Based on … • actual flow of energy • actual system operating conditions • LMPs … • are equal when transmission system is unconstrained • vary by location when transmission system is constrained
Factors That Affect LMP • Energy Demand • Economic Dispatch • Available Flexible Generating Units • Network Topology • Binding Transmission Limits
How Does PJM use LMP? • Generators get paid at generation bus LMP • Loads pay at load bus LMP • Transactions pay congestion charges equal to difference between source and sink LMPs
What Are FTRs? Fixed Transmission Rights are … a financial contract that entitles holder to a stream of revenues (or charges) based on the hourly energy price differences across the path
Why Do We Need FTRs? • Challenge: • LMP exposes PJM Market Participants to price uncertainty for congestion cost charges • During constrained conditions, PJM Market collects more from loads than it pays generators • Solution: • Provides ability to have price certainty • FTRs provide hedging mechanism that can be traded separately from transmission service
Why Use FTRs? • To create a financial hedge that provides price certainty to Market Participants when delivering energy across the PJM system • To provide firm transmission service without congestion cost • To provide methodology to allocate congestion charges to those who pay the fixed cost of the PJM transmission system
Characteristics of FTRs • Defined from source to sink • MW level based on transmission reservation • Financially binding • Financial entitlement, not physical right • Independent of energy delivery
What are FTRs Worth? • Economic value determined by hourly LMPs • Benefit (Credit) • same direction as congested flow • Liability (Charge) • opposite direction ascongested flow
Energy Delivery Consistent with FTR Thermal Limit Energy Delivery = 100 MWh FTR = 100 MW Bus B Bus A Source (Sending End) Sink (Receiving End) LMP = $15 LMP = $30 Congestion Charge = 100 MWh * ($30-$15) = $1500 FTR Credit = 100 MW * ($30-$15) = $1500
Energy Delivery Not Consistent with FTR (I) Bus A LMP = $10 Bus B Bus C Energy Delivery = 100 MWh LMP = $30 LMP = $15 FTR = 100 MW Congestion Charge = 100 MWh * ($30-$15) = $1500 FTR Credit = 100 MW * ($30-$10) = $2000
Energy Delivery Not Consistent with FTR (II) Bus A LMP = $20 Bus B Bus C Energy Delivery = 100 MWh LMP = $30 LMP = $15 FTR = 100 MW Congestion Charge = 100 MWh * ($30-$15) = $1500 FTR Credit = 100 MW * ($30-$20) = $1000
Obtaining FTRs • Network service • based on annual peak load • designated from resources to aggregate loads • Firm point-to-point service • may be requested with transmission reservation • designated from source to sink • Secondary market -- bilateral trading • FTRs that exist are bought or sold • FTR Auction -- centralized market • purchase “left over” capability
PJM FTR Auction Summary:May 1999-June 2000 • Total Bids Submitted - 17,956 • Total Bids Cleared - 3,360 • Total FTR MW Cleared - 50,724 • Total Auction Revenue - $2,450,958 • Percent of Congestion Charges Allocated Through FTRs • 1998 - 78% • 1999 - 90% • 2000 - 100%
Trading Hubs • Cross section of representative buses • Price less volatile than a single point • Common point for Commercial Trading • Three Hubs: - Western (111 Buses) - Eastern (237 Buses) - Interface (3 Buses) • Weighted Average Price based on fixed, equal weights at each bus
Delivery Options for Trading Hubs • Bilateral Transactions from External System (Energy or load outside of PJM) - Firm, Non-firm paying Congestion, or Non-firm transmission service with the Trading Hubs designated as the Sink or Source • Internal Bilateral Transactions (energy stays within PJM) - eSchedules (Internet based scheduling system for internal deals) - Source/Sink of Transaction uses trading Hub • Spot Market Purchase/Sale - PJM matches generator/load requirements (balancing); accounted for through the PJM Spot Market - Source or Sink of Spot Market can be designated at Trading Hubs
PA NJ MD DC DE VA 9. External Systems Available for Delivery NEPEX NYPP-W NYPP-E CEI (FE) APS VaPwr
NORTHEAST TRANSFERS * TTC’s in MWh 1370 Hydro Quebec 940 New Brunswick 400 670 Ontario 2200 700 1800 175 1575 2400 NEPOOL 1275 1500 New York 1800 2800 MAAC ECAR-Vacar 2850 6500 6500 6500 6500 ECAR-Vacar
Experience with Trading Hubs • The Western Hub is by far the most actively traded location • The majority of deals that are intended to be booked out are at the Western Hub • The published indices are for Western Hub • The “broker market” trade the PJM Western Hub almost exclusively • The day ahead market, which is predominately Western Hub, is considered by many to be the the most liquid market in country