Download
1 / 13
130 likes | 224 Views
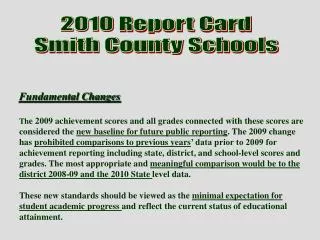
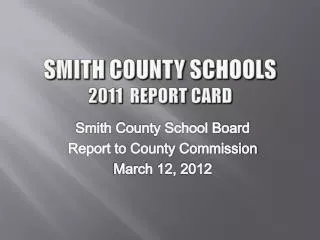
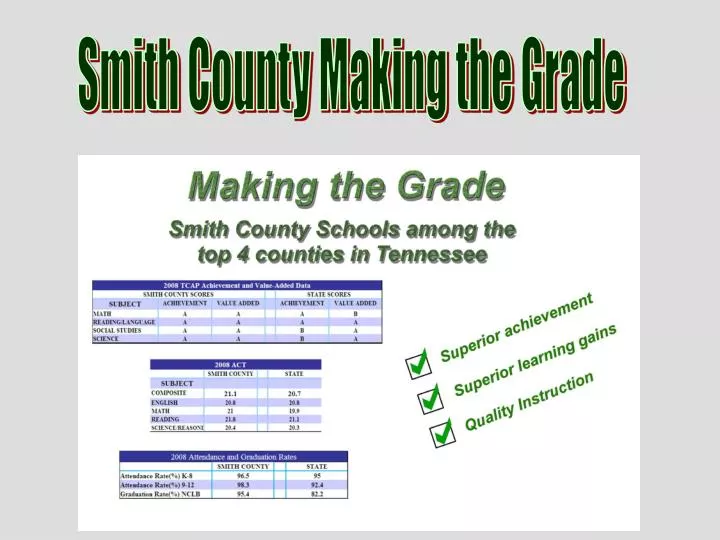
Smith County Making the Grade. Smith County Making the Grade. TEST INFORMATION. Smith County Making the Grade. AYP Targets- Elementary/ Middle. Percent Proficient. Smith County Making the Grade. Smith County Making the Grade.

E N D
Smith County Making the Grade AYP Targets- Elementary/ Middle PercentProficient
2008 TVAAS System Value Added Report for Smith County TCAP CRT Math
TVAAS DATA 2008 TCAP CRT: Math Student Report for
How to Interpret the Grade Scale http://www.k-12.state.tn.us/rptcrd05/gradescale.htm Use this information to determine your school’s Achievement and Value Added Grade Grade Grade Status Status Writing Assessment Mean Gain Range Achievement 3 - 8 Goal: 4.0 Rding/LA Math Science Social Studies Reading/Language Arts Math Social Studies Science Score/Range Score/ Range Score/ Range Score/Range Score/Range A Exceptional > 1.2 >1.5 >0.4 >0.6 A Exemplary 4.0 – 6.0 57-99 56-99 59-99 60-99 B Above Ave. 3.5 – 3.9 52-56 51-55 54-58 54-59 B Exceeds State Growth Standard 0.7 to 1.2 0.5 to 1.5 -0.1 to 0.4 -0.2 to 0.6 C Average 3.0 – 3.4 46-51 46-50 49-53 48-53 C Maintains State Growth Standard - 0.1 to 0.6 -0.5 to 0.4 -0.8 to -0.2 -1.1 to -0.3 D Below Ave. 2.5 – 2.9 41-45 39-45 42-48 41-47 D Below State Growth Standard -0.6 to -0.2 -1.9 to -0.6 -1.6 to -0.9 -1.9 to -1.2 F Deficient 0.0 – 2.4 0-40 0-38 0-41 0-40 F Deficient <-0.6 <-1.9 <-1.6 <-1.9 CRT Achievement TVAAS/Value AddedWhat's this?
TEACHER TOOLS • Internet4classrooms.com- use this site • Accelerated Reader- Great supplemental tool • Think link (TCAP/Gateway) teacher resources- great web sites to help meet spi needs • Collins Writing, Six Trait and Power Writing- strategies to improve writing • DIBELS- Kindergarten and First grade • Brain Pop • Academy for Reading- New Spring 08 • COMP – Classroom Management Training- Provided to all new teachers • RTI – Small Group Instruction, Data Driven Instruction • Literacy Now! – Reading Instruction K-12 • A+ (Anywhere Learning System)- Updated 07-08 • 12 Powerful Words (Larry Bell) • Blooms Taxonomy-Implement Higher Order Thinking- highest level needed. • TN Academic Vocabulary Pickering/Marzano- (Given at Back to School In-service) • Marcia, Marcia, Marcia- Use the Differentiated Instructional Strategies for varied learners • TCAP Coach-New 07-08 • Study Island • Graduation Coach
Keys for Success • Literacy Lab in Every K-8 School • Focus on Value Added Data • Top 10 in Value Added System Use in the State • Identify Student Needs for Growth • Data Driven Instruction • Use Multiple Assessment Tools • Think Link, A+, Study Island, Academy of Reading • Assessment Leader in Each School • Graduation Coach • Dedicated Administrators, Teachers, and Support Personnel