Download
1 / 1
10 likes | 99 Views
Explore the findings and trends from the ABRF-MARG 2004-2005 Microarray Survey, highlighting insights into microarray facilities, bioinformatics challenges, and future directions in the field. Discover key statistics and comparisons with past surveys.

E N D
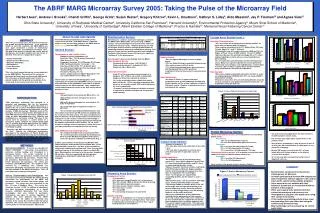
ABSTRACT Over the past several years, the field of microarrays has grown and evolved drastically. In its continued efforts to track this evolution, the ABRF-MARG has once again conducted a survey of international microarray facilities and individual microarray users. The goal of the survey is to profile the current state of microarrays and to gain insights into new trends in the field. The survey is composed of six parts: - General Information - Spotted (2-color) Microarrays - Affymetrix GeneChips - Bioinformatics - Future Directions - Protein Arrays This is the fourth annual microarray survey conducted by the ABRF-MARG. The results of the survey are presented and new trends are discussed. Additionally, the survey was evaluated against past surveys to provide insights into the growth and evolution of the community of microarray researchers over time. • RESULTS AND DISCUSSION • Presented and discussed herein is a summary of the responses to the 2004 - 2005 MARG Survey. A detailed analysis of the survey will be posted on the ABRF web site (www.abrf.org) after the ABRF 2005 Meeting. • General Section: • Demographics and Facility Profile: • Number of survey respondents: 213 • Institution Type: 75% Academic/Government • Open Access: 64% Yes • Geographic Location: 67% US/Canada, 26% Europe • # MA Facilities/Institution: 1.8 (range: 1 - 12) • User base of MA Facility: 77% Academic/Gov’t • Use formal Good Laboratory Practice program: 34% • Teaching Program: 54% Yes • Full Service Facility: 76% Yes • Assess sample quality via Agilent Bioanalyzer: 67% • Use as benchmark to use sample: 62% • These results are similar to the demographics of the respondents of the 2001 and 2003 MARG surveys in which at least two-thirds of the respondents were from an academic setting located in the US and Canada. Thus, comparisons can be made between the results of the 2005 survey and the previous surveys. • Personnel: • Average number of personnel per MA facility = 3.8 • Staff members have an average of 3.5 years of experience • MA facility director/manager has an average of 4.6 years of experience • 52% of the labs plan to expand the number of personnel • 49% of facilities have dedicated bioinformatics staff • The number of personnel per MA facility has dropped from 4.7 to 3.8 since the 2003 survey. The years of experience of both the director and staff members have increased from an average of 2.3 and 1.5 years, respectively. Interestingly, in 2001, 83% of respondents indicated that they would expand the number of personnel in their facilities. The ca. 2 year increase in average levels of experience is likely due to the 2 year time period that has elapsed since the last survey. • Data Validation and Challenge Areas: • 88% validate their MA results using real-time PCR • 57% of the respondents indicated that bioinformatics which includes MA data management and analysis creates the greatest challenge for a MA facility (Fig. 1) • In 2001, equal numbers of labs were using Northern blot, RNase protection and real-time PCR to validate data. In the 2003 and 2005 surveys, 80% and 88% of the respondents, respectively, validate with real-time PCR. Thus, real-time PCR continues to grow as the method of choice to validate MA data. Bioinformatics continues to be the greatest struggle for MA facilities. One user complained that their greatest challenge was working with explaining statistics to biologists. • Bioinformatics Section: • Bioinformatics continues to present challenges as noted in the MARG 2001, MARG 2003 and current (Fig. 1) MARG surveys. Array technologies have become more stable and reliable over the past 5 years. However many labs are now focusing on issues involved in taking high density data to knowledge and more importantly knowledge to meaning. Data analysis is time intensive and structured by each individual. Therefore, bioinformatics issues still represent a significant “bottleneck” in the array process. • Here we report some relevant findings from the MARG Bioinformatics Survey: • Responding to this section: 104/150 (69.3%) • Who analyzes the data?: Individual PI (78%) Statistician (48%) Other (40%) • Summary of Results: • Only 70% of the respondents keep their data in a database. 46% of these use custom or homemade databases rather than commercial solutions. • 37% of the respondents never submit their data to public databases. Of the remaining respondents who always or occasionally submit, GEO and ArrayExpress are evenly represented. • “Freeware” analysis packages are used as frequently as commercial software packages and are generally rated favorably. • Custom Array Section (cont.): • Technical Characteristics: • 99% of facilities are using fluorescent labeling and 99% of those labs are labeling with Cy3 and Cy5. • Slide coatings used consist of of 37% Amino Silane, 29% poly L-lysine, Epoxy 14% and 7% Aldehyde. • Printing buffers are 84% made in-house for cDNA and 74% for Oligos, of these 1/3 use 3X SSC, another 1/3 use 50% DMSO. • Split pins dominate the printing technology with a 73% share. • Indirect labeling is used by twice as many respondents as direct labeling. • 67% of respondents printing human and 56% printing mouse arrays. Many cross-species experiments are also performed. • While most users employ 2-color hybridizations, several report 4 or more colors used on a regular basis and one reported using a maximum of 100 colors per experiment. • Data Analysis: • Most users employ background subtraction and 58% of users are employing Global LOWESS while 47% use Local LOWESS normalization strategy. • Responses shows that 82% are normalizing between arrays by using an average of array global intensity with another 25% of respondents using the intensity. • Quality Control: • 82% use Agilent Bioanalyzer to assess sample quality • 74% use Global Scaling to normalize between arrays • 66% rarely or never run Test3 arrays • 3’/5’ ratio of housekeeping genes, percent present, and Background Noise are the parameter respondents felt were most useful in assessing array quality • User Satisfaction: • As shown in Table 2, it appears that most respondents were at least moderately satisfied with the data quality and the system hardware using their Affymetrix system. However, respondents were less satisfied with the software. The ABRF MARG Microarray Survey 2005: Taking the Pulse of the Microarray FieldHerbert Auer1, Andrew I. Brooks2, Chandi Griffin3, George Grills4, Susan Hester5, Gregory Khitrov6, Kevin L. Knudtson7, Kathryn S. Lilley8, Aldo Massimi9, Jay P. Tiesman10 and Agnes Viale11Ohio State University1, University of Rochester Medical Center2, University California San Francisco3, Harvard University4, Environmental Protection Agency5, Mount Sinai School of Medicine6,University of Iowa7, University of Cambridge8, Albert Einstein College of Medicine9, Procter & Gamble10, Memorial Sloan Kettering Cancer Center11 INTRODUCTION DNA microarray technology has emerged as a powerful and prominent tool for the molecular biologist to assess changes in gene expression at a global scale. As a result, a multi-billion dollar industry has evolved that is based on the production, use, and analysis of DNA microarrays. Moreover, many of the principles that have originally been developed for use with DNA microarrays have since been applied to the study of other macromolecules (e.g., proteins and antibodies) in a microarray setting. The aims of this survey were to construct a current profile of a microarray facility, compare the current profile with that of a profile previously generated by the MARG, and perhaps provide some insight as to where this technology is going. Currently, two DNA microarray platforms dominate the field. Namely, the slide-based technologies developed in the laboratories of Patrick Brown and Ronald Davis at Stanford University and the GeneChip technology developed by Affymetrix, Inc. One of the additional aims of this survey, therefore, has been to address specific aspects unique to each platform. • Protein Microarray Section: • Home made protein arrays: all 13 respondents use homemade protein arrays • Array Surface • 75% use two dimensional surfaces • 50% use three dimensional gel-based surfaces • Throughput • 60% = less than 20 slides/month (6/10 labs) • 30% = 20-100 slides/month (3/10 labs) • 10% = more than 100 slides/month (1/10 labs) • Commercial protein arrays: 3/13 of protein array facilities offer commercial arrays in addition to home made arrays • Throughput • 25% = less than 20 slides/month • 75% = 20-100 slides/month • Array content of the protein arrays is shown in Figure 5. • Out of all novel array applications the most interest is in CGH and splice variant arrays. • For all novel array applications human tissue is the primary source. • Array of Array technologies is only of interest to 40% of all array labs. Most labs will look at 1,000 genes or less using this technology. • Human SNP arrays are used in over 50% of array laboratories with linkage analysis as the primary source of data analysis. • 50% of all array labs are preparing to offer clinical diagnostic services. • Custom Array Section: • Number of responses: 97 • 72% were able to generate usable data in less than 1 year • 17% have been in operation less than 2 years while 63% have been in operation 3 years or longer. • Facility Equipment: • All respondents have at least one microarray scanner, 82% have robotic equipment for printing, 57% have liquid handling robotics and 32% have an automated hybridization station. • Figure 4 illustrates that most facilities are printing both PCR products/cDNA and Oligonucleotides, with the latter becoming more popular over time (82% of respondents have used Oligos). • From 1 to 310 groups are supported by responding facilities, but the median is only 6 groups. • Most facilities print, <100 arrays/month, with Oligo arrays showing somewhat higher quantities. • The average number of features peaks in the 10k to 25k range, with the high end beginning to be dominated by Oligo arrays, indicating an easier path in scaling to larger arrays since the printing products can be readily purchased. • Most users seemed to be at least moderately satisfied with the performance of their arrayers (77%) and scanners (82%). But, users continue to be less satisfied with the support they receive for their instruments (53% for arrayer support & 64% for scanner support respectively). This represents a slight decrease in performance satisfaction from the 2003 survey. • METHODS • Survey Development. A survey was designed to collect information concerning instrumentation, protocols, staffing, funding, and throughput in a microarray facility. The survey consisted of 6 sections: General (22 questions), Custom Array (28 questions), Affymetrix (28 questions), Protein Array (20 questions), Bioinformatics (10 questions), and Future Directions (42 questions). The survey was hosted by SurveyMonkey.com. The responses were collected by a third-party who removed any information identifying the participant prior to making the data available to the MARG for analysis. Thus, all participants have remained anonymous. • Survey Dissemination and Participation. The survey was announced on October 26, 2004 by posting instructions for participation on the ABRF and microarray related electronic discussion groups and listservers. The survey was also announced in the Nov. 10 issue of BioArray News. The survey was closed on January 7, 2005. In addition to laboratories that offer microarray technologies as a shared resource, individual laboratories that have these technologies were also invited to participate. Participation was open to anyone regardless of whether they were affiliated with the ABRF. Participants had the option of completing only sections of the survey that related to their microarray operation. This survey data was analyzed to build a current profile of microarray analysis laboratories • SUMMARY • Bioinformatics continues to be the primary challenge area for MA users. • In-house generated and freeware MA analysis and data management software appears to be used as much as the commercially available programs. • Users seem to be very satisfied with their Affymetrix System but are less satisfied with the software and its support. • While users appear to be satisfied with their custom microarrayers and scanners, few investigators at any given site appear to be using their custom array facility. • Of the facilities performing protein arrays, most are generating their own rather than using the commercially provided arrays. • Most technology users are preparing for clinical applications. • Affymetrix Array Section: • Respondent Profile: • 74 respondents • 66% have been using Affymetrix for 3 or more years • Over 80% provide cDNA synthesis thru Array Scanning • 75% offer downstream data analysis • 58% have at least 2 fluidics stations while • 79% have only 1 scanner • 21% using LIMS • 71% are running 50 arrays or less per week • Sample Labeling: • Over 80% of respondents use 1 round of amplification if they have 1 mg or more of starting material. Two rounds of amplification are primarily used if less than 1 mg of starting material is used (Table 1).


