Download
1 / 74
750 likes | 885 Views
Mobile Transit Planning with Real Time Data. Jerald Jariyasunant , Dan Work, Branko Kerkez , Eric Mai. Systems Engineering Program, Dept. of Civil and Environmental Engineering Center For Information Technology Research in the Interest of Society (CITRIS) UC Berkeley. Outline. Motivation

E N D
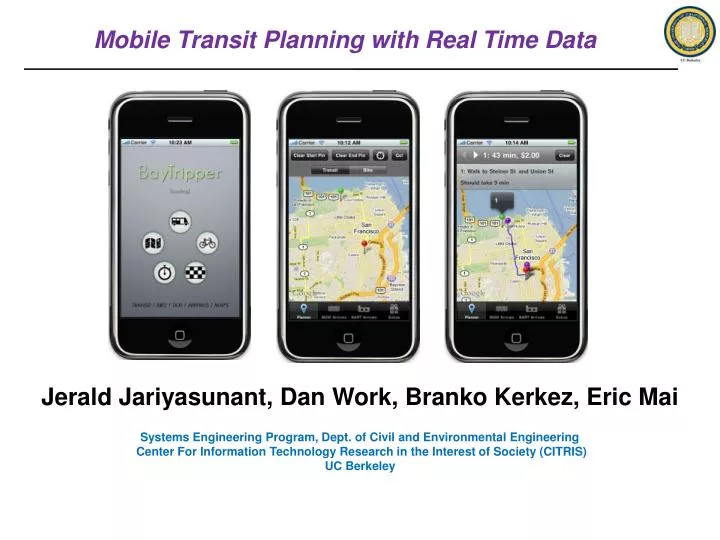
Mobile Transit Planning with Real Time Data Jerald Jariyasunant, Dan Work, BrankoKerkez, Eric Mai Systems Engineering Program, Dept. of Civil and Environmental Engineering Center For Information Technology Research in the Interest of Society (CITRIS) UC Berkeley
Outline • Motivation • System architecture • Routing with real-time data • System analysis • Mobile client implementation • Next steps
Outline • Motivation • System architecture • Routing with real-time data • System analysis • Mobile client implementation • Next steps
Current trip planning tools for mass transit • Schedule based trip planners exist • Real-time bus arrival information exists
Current trip planning tools for mass transit • Schedule based trip planners exist • Real-time bus arrival information exists
Problem of schedule adherence • percentage of vehicles that run on time according to schedule within (-1min, +4 min) • San Francisco area ~ 70% • Random passenger arrivals at bus stops cause buses to bunch, and deviate from the schedule. • Inherent to the system! • Hypothesis: Real time data is vital for trip planning [San Francisco Municipal Transportation Authority, 2008; Metropolitan Transportation Authority; Pilachowski and Daganzo, 09]
Problem of schedule adherence • percentage of vehicles that run on time according to schedule within (-1min, +4 min) • San Francisco area ~ 70% • Random passenger arrivals at bus stops cause buses to bunch, and deviate from the schedule. • Inherent to the system! • Hypothesis: Real time data is vital for trip planning [San Francisco Municipal Transportation Authority, 2008; Metropolitan Transportation Authority; Pilachowski and Daganzo, 09]
Outline • Motivation • System architecture • Routing with real-time data • System analysis • Mobile client implementation • Next steps
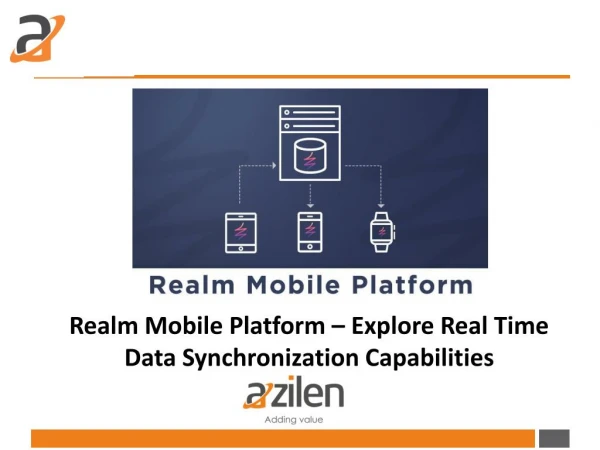
Needs from 3rd Party Providers • Static Data • Route Configuration Data • Schedule Data • Dynamic Data • Estimated Bus Arrivals to Stops
Needs from 3rd Party Providers • Static Data • Route Configuration Data • Schedule Data • Dynamic Data • Estimated Bus Arrivals to Stops
Outline • Motivation • System architecture • Routing with real-time data • System analysis • Mobile client implementation • Next steps
The Challenge • Transit trip planners based only on schedules have an easy problem – just find the shortest path. • Can be achieved with Dijkstra’s algorithm, A-Star, etc. With real-time data: • Numerous ways to get from point A to point B • Based on the location of buses, running early or behind schedule, the fastest path is always changing
The Challenge • Transit trip planners based only on schedules have an easy problem – just find the shortest path. • Can be achieved with Dijkstra’s algorithm, A-Star, etc. With real-time data: • Numerous ways to get from point A to point B • Based on the location of buses, running early or behind schedule, the fastest path is always changing
The graph Each lookup from the third party server costs time Cannot lookup wait/travel time of every link 3
Feasible Paths • Take advantage of the fact that we are finding the shortest path in a transit network • Create database of feasible path from Origin of every route to Destination of every route (San Francisco Muni = 87 x 87 table) Feasible paths: • Any possible path that takes 3 transfers or less • Remove any path that includes more routes than any other feasible path • Heuristic works for San Francisco • Database contains X paths between bus routes
Example Network F D E G H A B C
Built Database • List of feasible routes for each pair (includes location of transfer points)
Real Time Lookup F D E G H A B C
Outline • Motivation • System architecture • Routing with real-time data • System analysis • Mobile client implementation • Next steps
Experiment Description • 2 random points in San Francisco were generated • Various paths from point A to point B were determined by a schedule-based planner and a real-time trip planner and then compared • Buses were then tracked to find out the actual trip times between point A and point B along various paths
NextBus Arrival Estimates • Next bus arrival estimates are noisy • Median error is small (+/- 1 min) • They outliers are problematic • Need to be identified and filtered, or custom arrival estimator needed
Real-Time Planner vs. Schedule Based Planner Accurate Prediction Planner under-estimated trip time Percentage of trips Planner overestimated trip time Real-Time Mean: .91 StdDev: .19 Schedule Based Mean: .85 StdDev: .20 Ratio of estimated tt over actual tt
Real-time data is useful Statistically significant? • Result of Student-t test shows means are different • Result of Wilcoxon signed-rank test shows medians are different • Both CI > 99.99%
Additional Facts Compared single fastest path suggested by both transit trip planners with the ground truth (found by tracking buses) Schedule based planner • 15% of trips missed transfer (wait for next bus) • Predicted actual fastest path in 46% cases Real-time planner • 9% of trips missed transfer (wait for next bus) • Predicted actual fastest path in 53% cases
Outline • Motivation • System architecture • Routing with real-time data • System analysis • Mobile client implementation • Next steps
What’s next • Improved travel time estimation • Need to model the dynamics of the network to use the real time data more intelligently • Studies of travel behavior
Mobile Transit Planning with Real Time Data Questions Q Jerry JariyasunautBrankoKerkez Dan Work Systems Engineering Program, Dept. of Civil and Environmental Engineering Center For Information Technology Research in the Interest of Society (CITRIS) UC Berkeley
Outline • Motivation • System architecture • Routing with real-time data • System analysis • Mobile client implementation • Next steps
Outline • Motivation • System architecture • Routing with real-time data • System analysis • Mobile client implementation • Next steps
Outline • Motivation • System architecture • Routing with real-time data • System analysis • Mobile client implementation • Next steps