Download
1 / 1
10 likes | 227 Views
Three years of continuous CO 2 flux monitoring over a natural steppe in Hakasia (Russian Federation ) L.Belelli Marchesini (1) , R.Valentini (1) . (1) Department of Forest Resources and Environment, University of Tuscia, Via San Camillo de Lellis, 01100 Viterbo, Italy. 1- Shira region. 1.

E N D
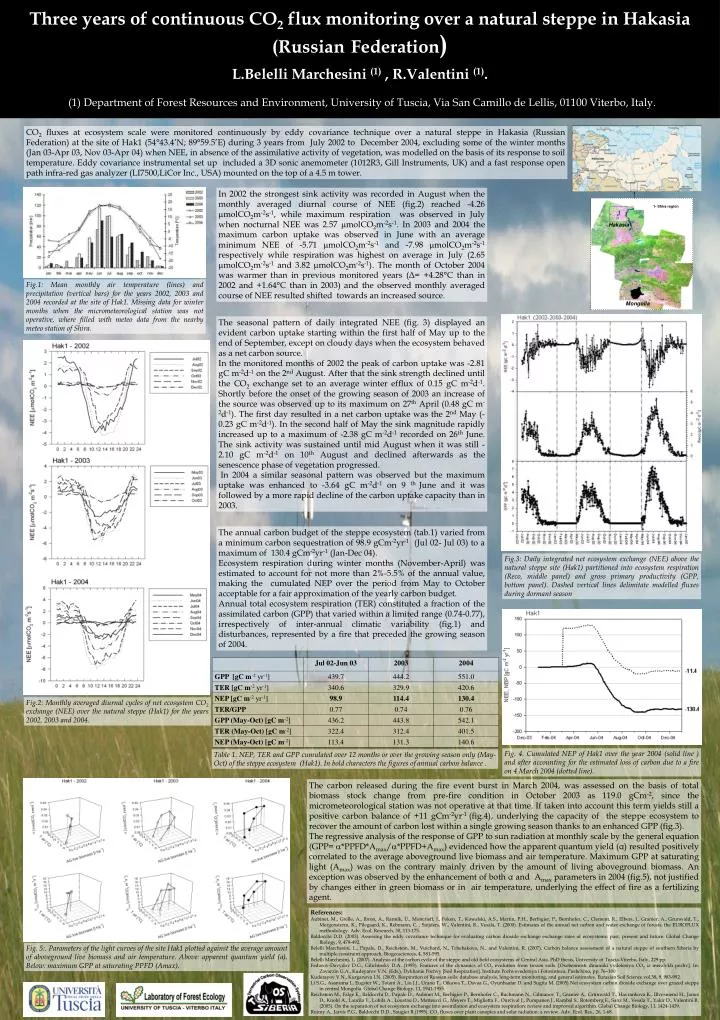
Three years of continuous CO2 flux monitoring over a natural steppe in Hakasia (RussianFederation) • L.Belelli Marchesini (1) , R.Valentini (1). • (1) Department of Forest Resources and Environment, University of Tuscia, Via San Camillo de Lellis, 01100 Viterbo, Italy. 1- Shira region 1 Hakasia Mongolia CO2 fluxes at ecosystem scale were monitored continuously by eddy covariance technique over a natural steppe in Hakasia (Russian Federation) at the site of Hak1 (54°43.4’N; 89°59.5’E) during 3 years from July 2002 to December 2004, excluding some of the winter months (Jan 03-Apr 03, Nov 03-Apr 04) when NEE, in absence of the assimilative activity of vegetation, was modelled on the basis of its response to soil temperature. Eddy covariance instrumental set up included a 3D sonic anemometer (1012R3, Gill Instruments, UK) and a fast response open path infra-red gas analyzer (LI7500,LiCor Inc., USA) mounted on the top of a 4.5 m tower. In 2002 the strongest sink activity was recorded in August when the monthly averaged diurnal course of NEE (fig.2) reached -4.26 mmolCO2m-2s-1, while maximum respiration was observed in July when nocturnal NEE was 2.57 mmolCO2m-2s-1. In 2003 and 2004 the maximum carbon uptake was observed in June with an average minimum NEE of -5.71 mmolCO2m-2s-1 and -7.98 mmolCO2m-2s-1 respectively while respiration was highest on average in July (2.65 mmolCO2m-2s-1 and 3.82 mmolCO2m-2s-1). The month of October 2004 was warmer than in previous monitored years (Δ= +4.28°C than in 2002 and +1.64°C than in 2003) and the observed monthly averaged course of NEE resulted shifted towards an increased source. Fig.1: Mean monthly air temperature (lines) and precipitation (vertical bars) for the years 2002, 2003 and 2004 recorded at the site of Hak1. Missing data for winter months when the micrometeorological station was not operative, where filled with meteo data from the nearby meteo station of Shira. The seasonal pattern of daily integrated NEE (fig. 3) displayed an evident carbon uptake starting within the first half of May up to the end of September, except on cloudy days when the ecosystem behaved as a net carbon source. In the monitored months of 2002 the peak of carbon uptake was -2.81 gC m-2d-1 on the 2nd August. After that the sink strength declined until the CO2 exchange set to an average winter efflux of 0.15 gC m-2d-1. Shortly before the onset of the growing season of 2003 an increase of the source was observed up to its maximum on 27th April (0.48 gC m-2d-1). The first day resulted in a net carbon uptake was the 2nd May (-0.23 gC m-2d-1). In the second half of May the sink magnitude rapidly increased up to a maximum of -2.38 gC m-2d-1 recorded on 26th June. The sink activity was sustained until mid August when it was still -2.10 gC m-2d-1 on 10th August and declined afterwards as the senescence phase of vegetation progressed. In 2004 a similar seasonal pattern was observed but the maximum uptake was enhanced to -3.64 gC m-2d-1 on 9 th June and it was followed by a more rapid decline of the carbon uptake capacity than in 2003. The annual carbon budget of the steppe ecosystem (tab.1) varied from a minimum carbon sequestration of 98.9 gCm-2yr-1 (Jul 02- Jul 03) to a maximum of 130.4 gCm-2yr-1 (Jan-Dec 04). Ecosystem respiration during winter months (November-April) was estimated to account for not more than 2%-5.5% of the annual value, making the cumulated NEP over the period from May to October acceptable for a fair approximation of the yearly carbon budget. Annual total ecosystem respiration (TER) constituted a fraction of the assimilated carbon (GPP) that varied within a limited range (0.74-0.77), irrespectively of inter-annual climatic variability (fig.1) and disturbances, represented by a fire that preceded the growing season of 2004. Fig.3: Daily integrated net ecosystem exchange (NEE) above the natural steppe site (Hak1) partitioned into ecosystem respiration (Reco, middle panel) and gross primary productivity (GPP, bottom panel). Dashed vertical lines delimitate modelled fluxes during dormant season Fig.2: Monthly averaged diurnal cycles of net ecosystem CO2 exchange (NEE) over the natural steppe (Hak1) for the years 2002, 2003 and 2004. Fig. 4. Cumulated NEP of Hak1 over the year 2004 (solid line ) and after accounting for the estimated loss of carbon due to a fire on 4 March 2004 (dotted line). Table 1. NEP, TER and GPP cumulated over 12 months or over the growing season only (May-Oct) of the steppe ecosystem (Hak1). In bold characters the figures of annual carbon balance . The carbon released during the fire event burst in March 2004, was assessed on the basis of total biomass stock change from pre-fire condition in October 2003 as 119.0 gCm-2, since the micrometeorological station was not operative at that time. If taken into account this term yields still a positive carbon balance of +11 gCm-2yr-1 (fig.4), underlying the capacity of the steppe ecosystem to recover the amount of carbon lost within a single growing season thanks to an enhanced GPP (fig.3). The regressive analysis of the response of GPP to sun radiation at monthly scale by the general equation (GPP= a*PPFD*Amax/a*PPFD+Amax) evidenced how the apparent quantum yield (α) resulted positively correlated to the average aboveground live biomass and air temperature. Maximum GPP at saturating light (Amax) was on the contrary mainly driven by the amount of living aboveground biomass. An exception was observed by the enhancement of both α and Amax parameters in 2004 (fig.5), not justified by changes either in green biomass or in air temperature, underlying the effect of fire as a fertilizing agent. References: Aubinet, M., Grelle, A., Ibron, A., Rannik, Ü., Moncrieff, J., Foken, T., Kowalski, A.S., Martin, P.H., Berbigier, P., Bernhofer, C., Clement, R., Elbers, J., Granier, A., Grunwald, T., Morgensterm, K., Pilegaard, K., Rebmann, C. , Snijders, W., Valentini, R., Vesala, T. (2000). Estimates of the annual net carbon and water exchange of forests: the EUROFLUX methodology. Adv. Ecol. Research, 30, 113-175. Baldocchi D.D. (2003). Assessing the eddy covariance technique for evaluating carbon dioxide exchange exchange rates of ecosystems: past, present and future. Global Change Biology, 9, 479-492. Belelli Marchesini, L., Papale, D., Reichstein, M., Vuichard, N., Tchebakova, N., and Valentini, R. (2007). Carbon balance assessment of a natural steppe of southern Siberia by multiple constraint approach, Biogeosciences, 4, 581-595. Belelli Marchesini, L. (2007). Analysis of the carbon cycle of the steppe and old field ecosystems of Central Asia. PhD thesis, University of Tuscia-Viterbo, Italy, 229 pp. Fedorov-Davydov D.G., Gilichinsky D.A. (1993). Features of the dynamics of CO2 evolution from frozen soils. [Osobennosti dinamiki vydeleniya CO2 iz merzlykh pochv]. In: Zavarzin G.A., Kudeyarov V.N. (Eds.), Dykhanie Pochvy [Soil Respiration]. Institute Pochvovedeniya i Fotosinteza, Pushchino, pp. 76–100 Kuderayov V.N., Kurganova I.N. (2005). Respiration of Russian soils: database analysis, long-term monitoring, and general estimates. Eurasian Soil Science vol.38, 9, 983-992. Li S.G., Asanuma J., Eugster W., Totani A., Liu J.J., Urano T., Oikawa T., Davaa G., Oyunbaatar D. and Sugita M. (2005) Net ecosystem carbon dioxide exchange over grazed steppe in central Mongolia. Global Change Biology, 11, 1941-1955. Reichstein M., Falge E., Baldocchi D., Papale D., Aubinet M., Berbigier P., Bernhofer C., Buchmann N., Gilmanov T., Granier A., Grünwald T., Havrankova K., Illvesniemi H., Janus D., Knohl A., Laurila T., Lohila A., Loustau D., Matteucci G., Meyers T., Miglietta F., Ourcival J., Pumpanen J., Rambal S., Rotemberg E., Sanz M., Vesala T., Yakir D., Valentini R. (2005). On the separation of net ecosystem exchange into assimilation and ecosystem respiration: review and improved algorithm. Global Change Biology, 11, 1424-1439. Ruimy A., Jarvis P.G., Baldocchi D.D., Saugier B.(1995). CO2 fluxes over plant canopies and solar radiation: a review. Adv. Ecol. Res., 26, 1-68. Fig. 5:. Parameters of the light curves of the site Hak1 plotted against the average amount of aboveground live biomass and air temperature. Above: apparent quantum yield (α). Below: maximum GPP at saturating PPFD (Amax).