Download
1 / 16
160 likes | 311 Views
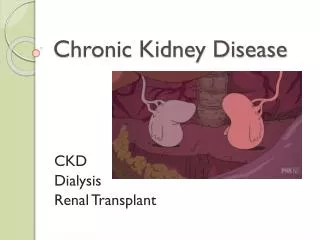
Healthy People 2010 Focus Area 4: Chronic Kidney Disease Progress Review September 21, 2006. Status of Chronic Kidney Disease Objectives. 4-1. End-stage renal disease 4-2. Cardiovascular disease deaths in persons with chronic kidney failure

E N D
Healthy People 2010 Focus Area 4:Chronic Kidney DiseaseProgress ReviewSeptember 21, 2006
Status of Chronic Kidney Disease Objectives 4-1. End-stage renal disease 4-2. Cardiovascular disease deaths in persons with chronic kidney failure 4-3. Counseling for chronic kidney failure care 4-4. Use of arteriovenous fistulas 4-5. Registration for kidney transplantation 4-6. Waiting time for kidney transplantation 4-7. End-stage renal disease due to diabetes 4-8a. Medical evaluation for persons with type 1 or type 2 diabetes and chronic kidney disease 4-8b. Medical treatment for persons with type 1 or type 2 diabetes and chronic kidney disease Target met Improving Getting worse Baseline data only
Incidence rate per 1,000,000 population End-stage Renal Disease, By Race/Hispanic Origin 1,200 Black 1,000 800 American Indian 600 Hispanic Asian 400 Total White 200 2010 Target 0 1997 1998 1999 2000 2001 2002 2003 2004 Note: American Indian includes Alaska Native. Asian includes Pacific Islander. Persons of Hispanic origin may be any race. SOURCE: United States Renal Data System (USRDS), NIH, NIDDK. Obj. 4-1
Incidence rate per 1,000,000 population End-stage Renal Disease Due to Diabetes, By Race/Hispanic Origin 1,200 1,000 800 600 American Indian Black 400 Hispanic Asian 200 Total White 2010 Target 0 1997 1998 1999 2000 2001 2002 2003 2004 Note: American Indian includes Alaska Native. Asian includes Pacific Islander. Persons of Hispanic origin may be any race. SOURCE: United States Renal Data System (USRDS), NIH, NIDDK. Obj. 4-7
ESRD and ESRD Due to Diabetes, By Race/Hispanic Origin Incidence rate per million End-stage Renal Disease End-stage Renal Disease Due to Diabetes 1,200 1,200 Black 1,000 1,000 800 800 American Indian 600 600 American Indian Black Asian Hispanic 400 Total 400 Asian Hispanic White Total 200 200 2010 Target White 2010 Target 0 0 1997 1998 1999 2000 2001 2002 2003 2004 1997 1998 1999 2000 2001 2002 2003 2004 Obj. 4-1 Obj. 4-7 Note: American Indian includes Alaska Native. Asian includes Pacific Islander. Persons of Hispanic origin may be any race. SOURCE: United States Renal Data System (USRDS), NIH, NIDDK.
Incidence rate per 1,000,000 End-stage Renal Disease, By Race and Gender 1998-2000 2001-2003 Men 2010 Target American Indian Asian Black White Women American Indian Asian Black White 400 600 0 200 800 1,000 1,200 Note: American Indian includes Alaska Native. Asian includes Pacific Islander. SOURCE: United States Renal Data System (USRDS), NIH, NIDDK. Obj. 4-1
Incidence rate per 1,000,000 population End-stage Renal Disease, By Health Service Area, 1993 Obj. 4-1 SOURCE: United States Renal Data System (USRDS), NIH, NIDDK.
Incidence rate per 1,000,000 population End-stage Renal Disease, By Health Service Area, 2003 Obj. 4-1 SOURCE: United States Renal Data System (USRDS), NIH, NIDDK.
Incidence rate per 1,000,000 population End-stage Renal Disease Due to Diabetes, By Gender 200 180 Males 160 Total 140 Females 120 100 2010 Target 80 60 40 20 0 1997 1998 1999 2000 2001 2002 2003 2004 Obj. 4-7 SOURCE:United States Renal Data System (USRDS), NIH, NIDDK.
Percent Use of Arteriovenous Fistulas* Among the Newly Diagnosed By Race/Hispanic Origin 80 70 American Indian 60 2010 Target Asian 50 40 White Hispanic 30 Total Black 20 10 0 1998 1999 2000 2001 2002 2003 Note: American Indian includes Alaska Native. Asian includes Pacific Islander. The categories black and white exclude persons of Hispanic origin. Persons of Hispanic origin may be any race. SOURCE: Centers for Medicare and Medicaid Services (CMS) Clinical Performace Measures (CPM) project. Obj. 4-4
Percent Use of Arteriovenous Fistulas Among the Newly Diagnosed By Gender 60 2010 Target 50 40 Males Total 30 20 Females 10 0 1998 1999 2000 2001 2002 2003 SOURCE: Centers for Medicare and Medicaid Services (CMS) Clinical Performance Measures (CPM) project. Obj. 4-4
Medical Evaluation for Persons with Diabetes and Chronic Kidney Disease Percent 60 50 White Asian Hispanic 40 2010 Target Black 30 American Indian 20 10 0 2000 2001 2002 2003 2004 Note: American Indian includes Alaska Native; Native Hawaiian includes other Pacific Islander. Persons of Hispanic origin may be any race. Only one race category could be recorded. Recording more than one race was not an option. SOURCE: Centers for Medicare and Medicaid Services (CMS); United States Renal Data System (USRDS), NIH, NIDDK. Obj. 4-8a
Medical Evaluation for Persons with Diabetes and Chronic Kidney Disease Percent Medical evaluation include eye examinations, lipid testing, and glycosylated hemoglobin (HbA1c) testing 60 50 White Asian Hispanic 40 2010 Target Black 30 American Indian 20 10 0 2000 2001 2002 2003 2004 Note: American Indian includes Alaska Native; Native Hawaiian includes other Pacific Islander. Persons of Hispanic origin may be any race. Only one race category could be recorded. Recording more than one race was not an option. SOURCE: Centers for Medicare and Medicaid Services (CMS); United States Renal Data System (USRDS), NIH, NIDDK. Obj. 4-8a
Medical Treatment for Persons with Diabetes and Chronic Kidney Disease 2010 Target 2000 Total * American Indian * Asian * Native Hawaiian Black White * Hispanic 0 10 20 30 40 Percent Note: American Indian includes Alaska Native; Native Hawaiian includes other Pacific Islander. Persons of Hispanic origin may be any race. SOURCE: USRDS. Obj. 4-8b
Medical Treatment for Persons with Diabetes and Chronic Kidney Disease Medical treatment includes the use of angiotensin converting enzyme inhibitors (ACE-I) and angiotensin receptor blockers (ARB) 2010 Target 2000 Total * American Indian * Asian * Native Hawaiian Black White * Hispanic 0 10 20 30 40 Percent Note: American Indian includes Alaska Native; Native Hawaiian includes other Pacific Islander. Persons of Hispanic origin may be any race. SOURCE: USRDS. Obj. 4-8b
Progress review data and slides are available on the web at: http://www.cdc.gov/nchs/hphome.htm