Download
1 / 43
430 likes | 558 Views
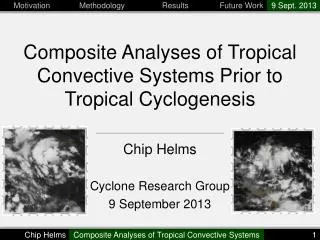
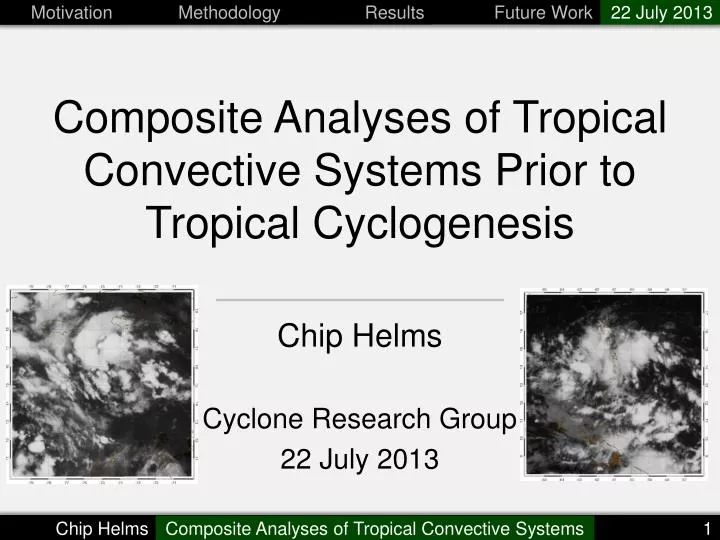
Composite Analyses of Tropical Convective Systems Prior to Tropical Cyclogenesis. Chip Helms Cyclone Research Group 22 July 2013. Motivatio n. Questions. What makes a tropical convective system (TCS) fail to develop? Especially for TCS expected to develop

E N D
Composite Analyses of Tropical Convective Systems Prior to Tropical Cyclogenesis Chip Helms Cyclone Research Group 22 July 2013
Motivation Questions • What makes a tropical convective system (TCS) fail to develop? • Especially for TCS expected to develop • How often/easily do TCSs change from being unfavorable for development to being favorable? • Is TCS structure a function of basin? Season? Mesoscale/Synoptic Scale Environments? Future development? Development pathway? • If so, what processes generate the relationship? • What causes a TCS to become vertically aligned with time? Do all TCS do so? What about this vertical alignment makes the low levels rapidly spin-up? What causes this spin-up to fail in non-developing systems?
Motivation Genesis Process Hypothesis Shear Hydrostatic response to heating profile results in PV convergenceand a non-linear feedback due to thermal wind balance Tropopause Latent Heat Release Convergence and ascent along wave Concentration of background vorticity produces low-level vortex 500 hPa Mid-Level Vortex +PV Cooling (Melting, Evaporation, Radiation?) Deep convection fuels formation of stratiformsheilddownshear Deep convection forms along convergence line Low-Level Vortex Surface Wave Axis
Motivation Vertical Alignment Process ?
Motivation Method Motivation • Two general approaches to studying genesis • Case Studies • Detailed analyses, may not be representative • Composite Studies • Represenative features, loss of detail • Solution: Composite on homogeneous subset • Select based on important, highly-variable structures • Make subset selections using phase space
Methodology Old Phase Space 15 Variables, 10 Plots N = 5817 All HURDAT Systems 2005-2012 ALL INVESTs
Methodology New Phase Space 12 Variables, 6 Plots
Methodology Current Variables • 500-850 hPa center displacement • 850, 500 hPa Mean Tangential Velocity • Mean 200-850 hPa Shear Vector • Mean removes axisymmetric component of vortex • 850,500 hPa Total Deformation • Mean derivatives to remove axisymmetric vortex • 500,200 hPaMean Relative Humidity • Mean Curl of 200-850 hPa Shear • Bulk Lapse Rate or Bulk Diabatics
Methodology Planned Variable Changes • Remove mean relative humidities • Add mean total precipitable water • Add ‘Percent Idealized’ • Measure of how close the wind field is to purely tangential cyclonic flow • Closed circulation has a lower value than a shear line
Methodology Moving Beyond NHC INVESTs • Using INVEST files introduces a selection bias and reduces potential data ranges • Only NHC basins from 2005 onwards • Vortex detection and tracking algorithm • Uses 850 hPa ‘Percent Idealized’ variable for vortex identification • Positions found using overlapping 5°x 5° boxes • Tracking based on Hart (2003) • Cyclone Phase Space vortex tracker
Methodology Example Vortex Identification
Methodology Idealized Example Mean Vλ Percent Idealized +
Methodology Tracking Algorithm (Hart 2003) • 5 Requirements: • New position is the closest at time t to where cyclone was at time • Cyclone motion = • where • Change in cyclone direction is within limits determined by cyclone movement speed no restrictions • System must last for 24 hours
Methodology Example Tracking First Pass Tracks Extensions Deletion Adjoint Tracks
Future Work Future Work • Run tracking algorithm • Extend to multiple data sets • Test and finalize phase space variables • Examine composites • e.g. Devvs Non-dev • System evolution in phase space
Results Year: 2010 N=516, Red=15
Results Year: 2010 N=107, Red=6
Results Year: 2010 N=25, Red=6
Results Year: 2010 N=45, Red=6
Results Year: 2010 N=16, Red=4
Results All HURDAT 2005-2012
Results INVEST/Pre-Genesis Systems Max Freq: 41 ~ 2.5%
Results Tropical Depressions
Results Tropical Storms
Results Hurricanes
Results Post Extra-Tropical Transition
Results Sandy (2012)
Results Sandy (2012): 10/18 – 10/21
Results Sandy (2012): 10/22 – 10/25
Results Sandy (2012): 10/26 – 10/29
Results Sandy (2012): 10/30 – 10/31
Prior Work Theory Simpson et al. (1997) and Ritchie and Holland (1997) Concentration term Stratiform Latent Heating Mergers of PV anomalies add PV while averaging thermal properties MCS Stretching term New PV Anomaly Out of balance with thermal structure Warm anomaly growth not detailed by theory, but would be accomplished by forced subsidence or increased LHR + PV Anomaly + Evaporative Cooling Forced Convergence Forced Ascent and Evaporative Cooling Act to cool sub-cloud layer
Pre-Genesis Phase Space 200-850 hPa 500-850 hPa 500 hPa 850 hPa Displacement of 500 hPa center Displacement vs Tilt Direction Displacement vs Shear Stronger Mid Vortex Stronger Low Vortex 500-850 hPa Shear vs 500-850 hPaVorticity Difference Vorticityvs Divergence ~Bulk Lapse Rate vs Upper Level Moisture N = 5817 All HURDAT Systems 2005-2012 500 hPa Vλvs 850 hPaVλ Upper-level T’ vs Spec. Hum.
Motivation Example: Non-developing system
Motivation Genesis: 6/23 Cyclone Tracy (1974) Genesis: 12/21 Image courtesy Clark Evans Landfall: 12/24 110 kts (Saffir-Simpson Cat. 3) Image courtesy Wikipedia
Motivation Issues with Traditional Composites • Mid-level features will appear weaker • High variability in system tilt • Vertically-aligned systems tend to be stronger • Composites will favor upright systems
Methodology Methodology/Data • Locate center at 850 and 500 hPa 1) Maximum Vλ (0.5° search grid) 2) Minimum Difference of Vλand V (0.25°) 3) Minimum Difference of Vλ and V (0.10°) • Datasets: CFSRv2, HURDAT2+INVESTs • Convenient for testing methodology • CFSR: Uniform in time • Complete with all the selection bias caveats of the INVEST files
Motivation Genesis Process Hypothesis Tropopause 500 hPa Surface
Motivation Genesis Process Hypothesis Tropopause Vort. Max 500 hPa Surface
Motivation Genesis Process Hypothesis Tropopause 500 hPa Surface