Download
1 / 10
100 likes | 214 Views
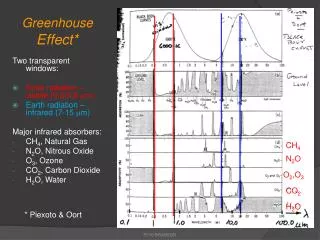
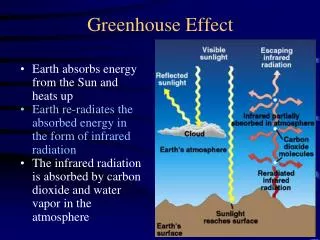
Super Greenhouse Effect Detection from Aqua instruments. Dan Feldman Notes for DC Trip 10/16/05. Clear-sky greenhouse parameter. g increases linearly with SST for SST<298K g increases at a much faster rate for SST>298 K From Ravel and Ramanathan (1989) using ERBE data.

E N D
Super Greenhouse Effect Detection from Aqua instruments Dan Feldman Notes for DC Trip 10/16/05
Clear-sky greenhouse parameter • g increases linearly with SST for SST<298K • g increases at a much faster rate for SST>298 K • From Ravel and Ramanathan (1989) using ERBE data
g is sensitive to upper tropospheric H2O • MLS (aboard AURA) sensitive to ice-water content and UT H2O • g vs. SST similar for AIRS and MLS • Super greenhouse effect visible from both instruments • What about convection?
Radiative forcing due to SST>298K • Do SSTs >298K contribute to increased cloud cover and/or cloud reflectivity to counteract conventional definition of super greenhouse effect? • Answer may lie with AIRS and CERES data • AIRS: UT H2O, cloud fraction, SST • CERES: Albedo 0.3 um to 5 um
Analysis period: 08/2004-01/2005 • AIRS UT H2O product agrees well with MLS and radiosondes at ARM TWP site (Nauru) • SSTs in western Pacific ~300 K • AIRS cloud fraction well-correlated to SST >298 K • Low UT H2O correlated with low albedo as measured by CERES. The converse statement is not as well supported by the data.